
Charting tools
How Geometriya’s Gann and geometry tools work, what they show on a chart, and how to use them. Every tool is drawn on Mitotic Scaling, so angles and squares stay true at any zoom.
Gann
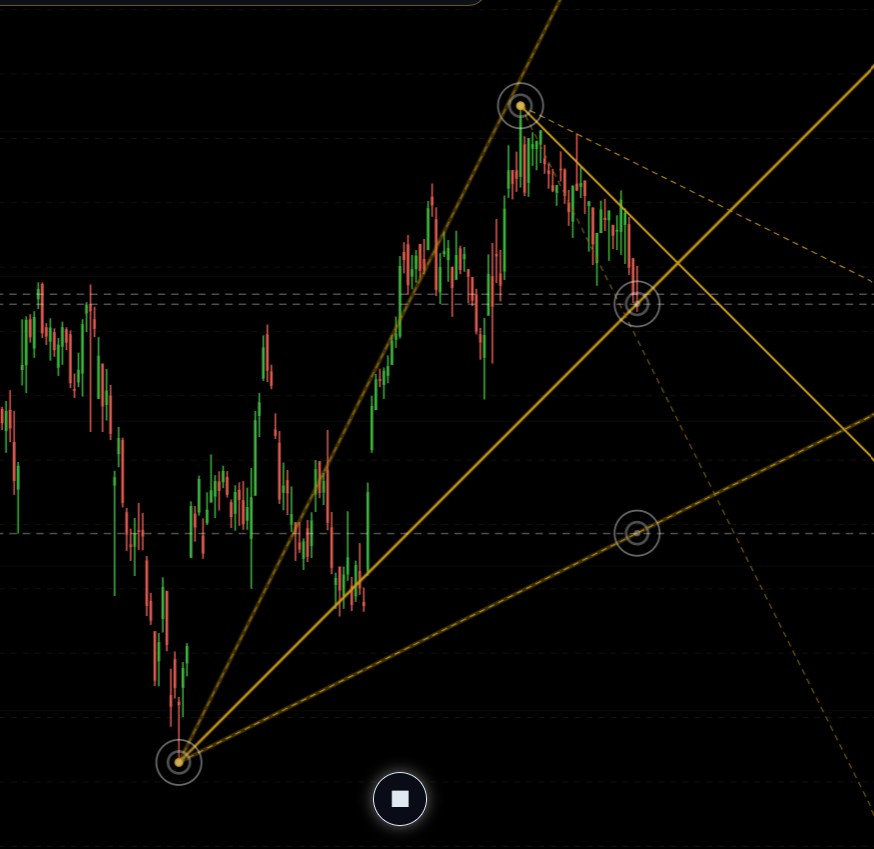
Dream-45
Plant W. D. Gann’s 1×1 (45°) angle on a swing low or high, and the Dream-45 scanner lists every stock whose price is back on its angle today.
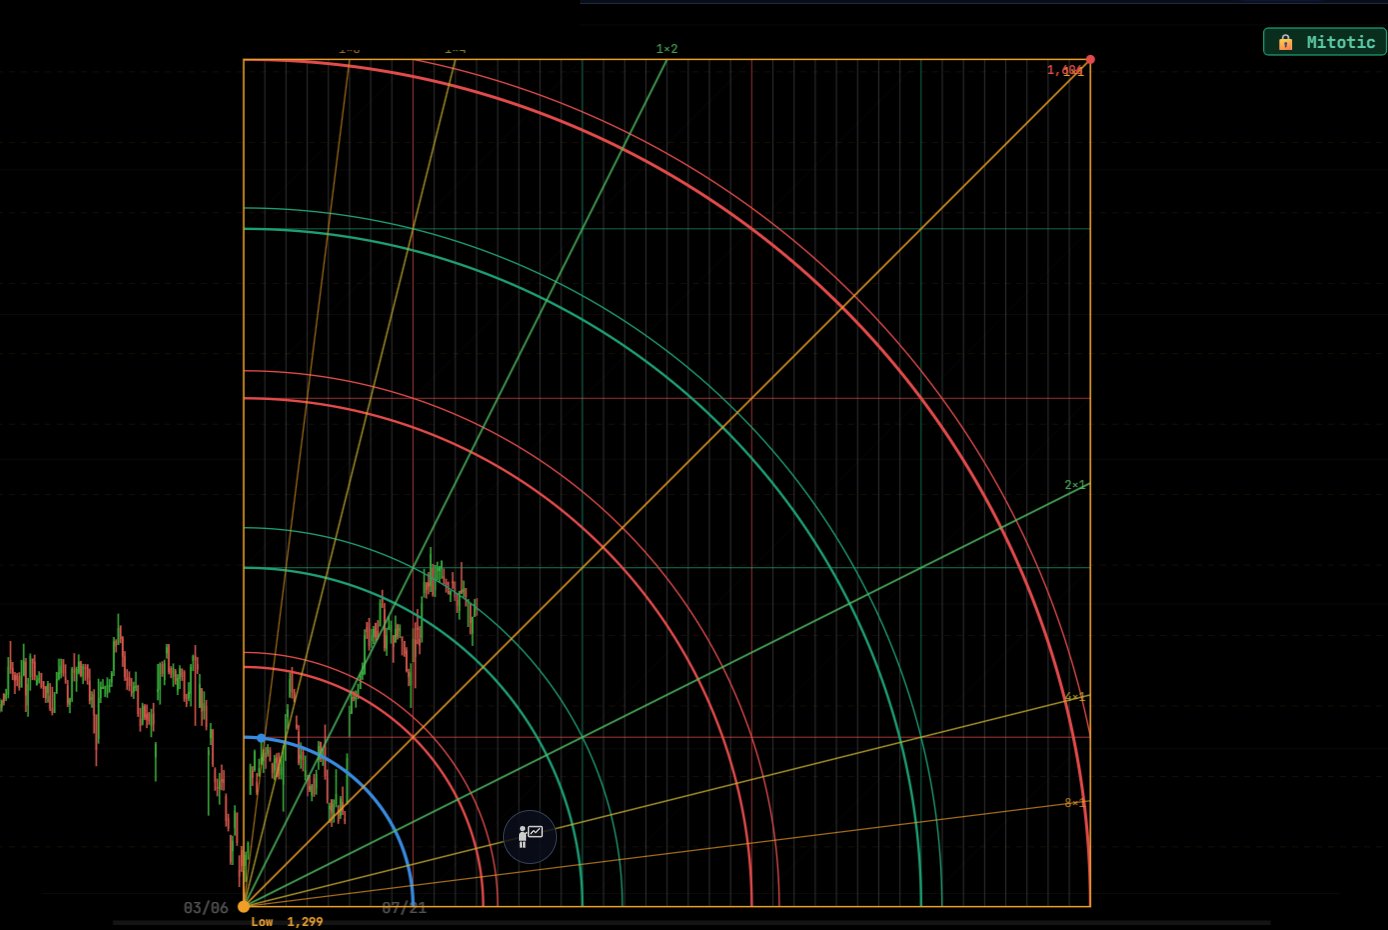
Gann Box (Gann Square)
Place a Gann Box from a swing low or high in one click: 5×5 or 8×8 squares, arcs, the 1×1 balance line, an angle fan and time subdivisions.
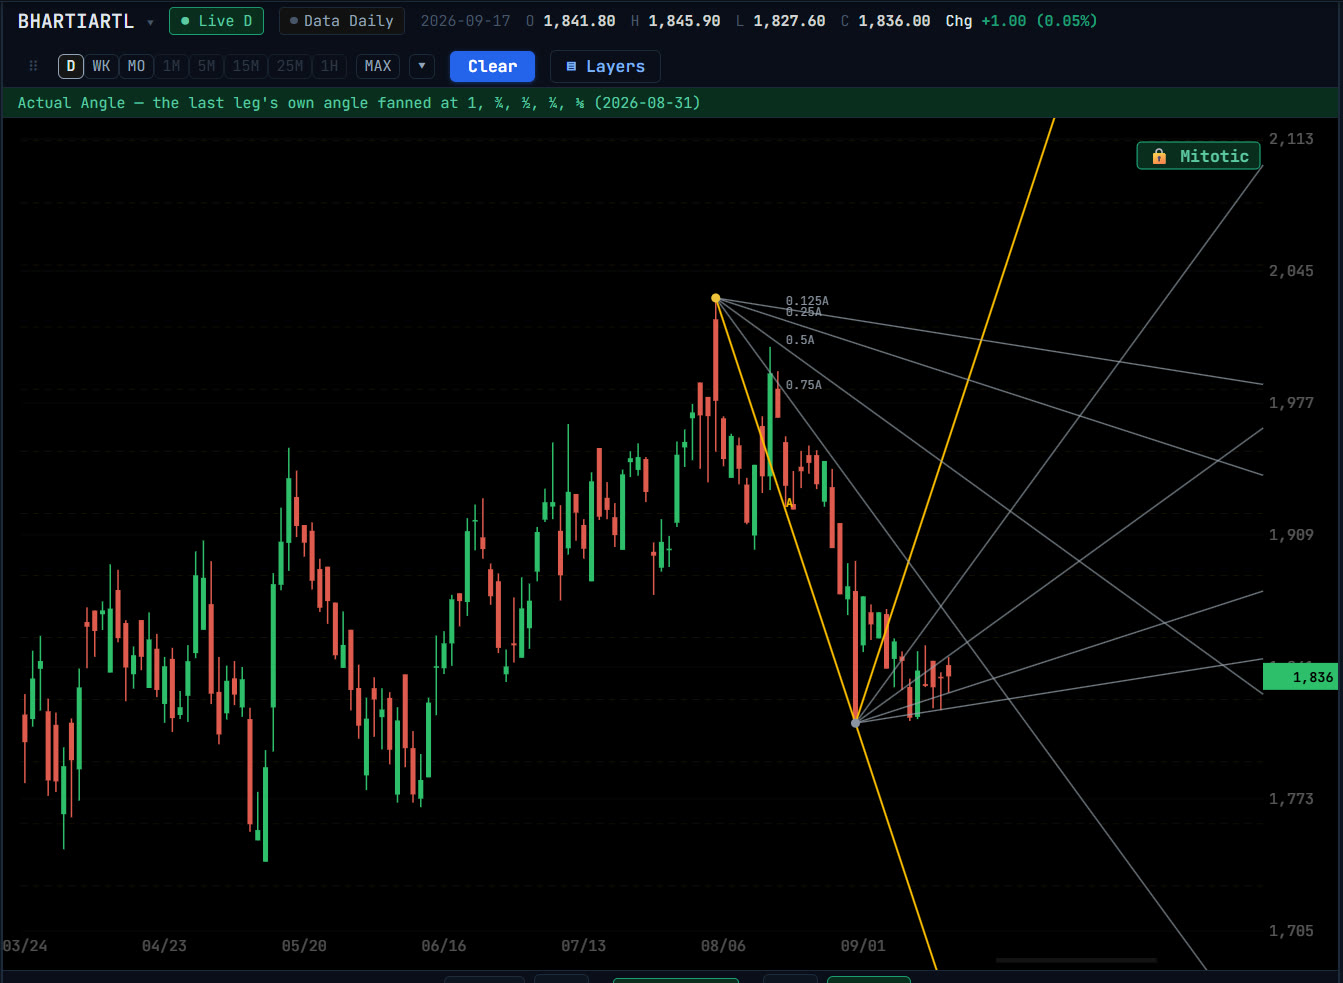
Gann Angles
Gann angle tools beyond the 45°: convert a price into an angle, fan a swing’s own angle, bounce 45° lines off zero, and the Secret Angle’s forward dates.
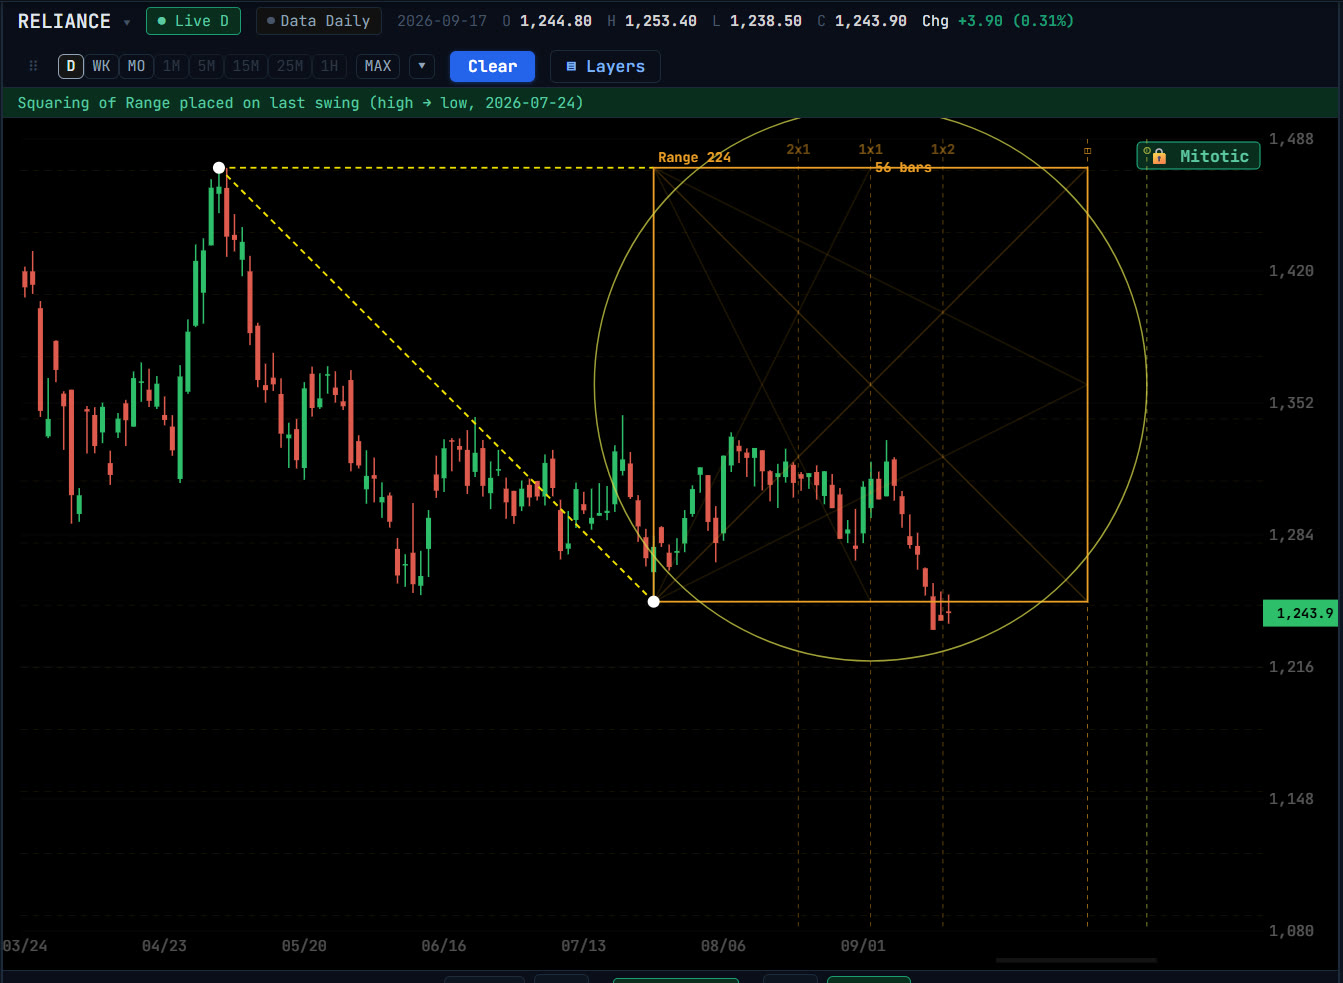
Squaring Price and Time
Square a low, a high or a swing’s range against time, convert price into a forward bar count, and look back one price’s worth of bars. Gann squaring tools.
Fibonacci, waves and harmonics
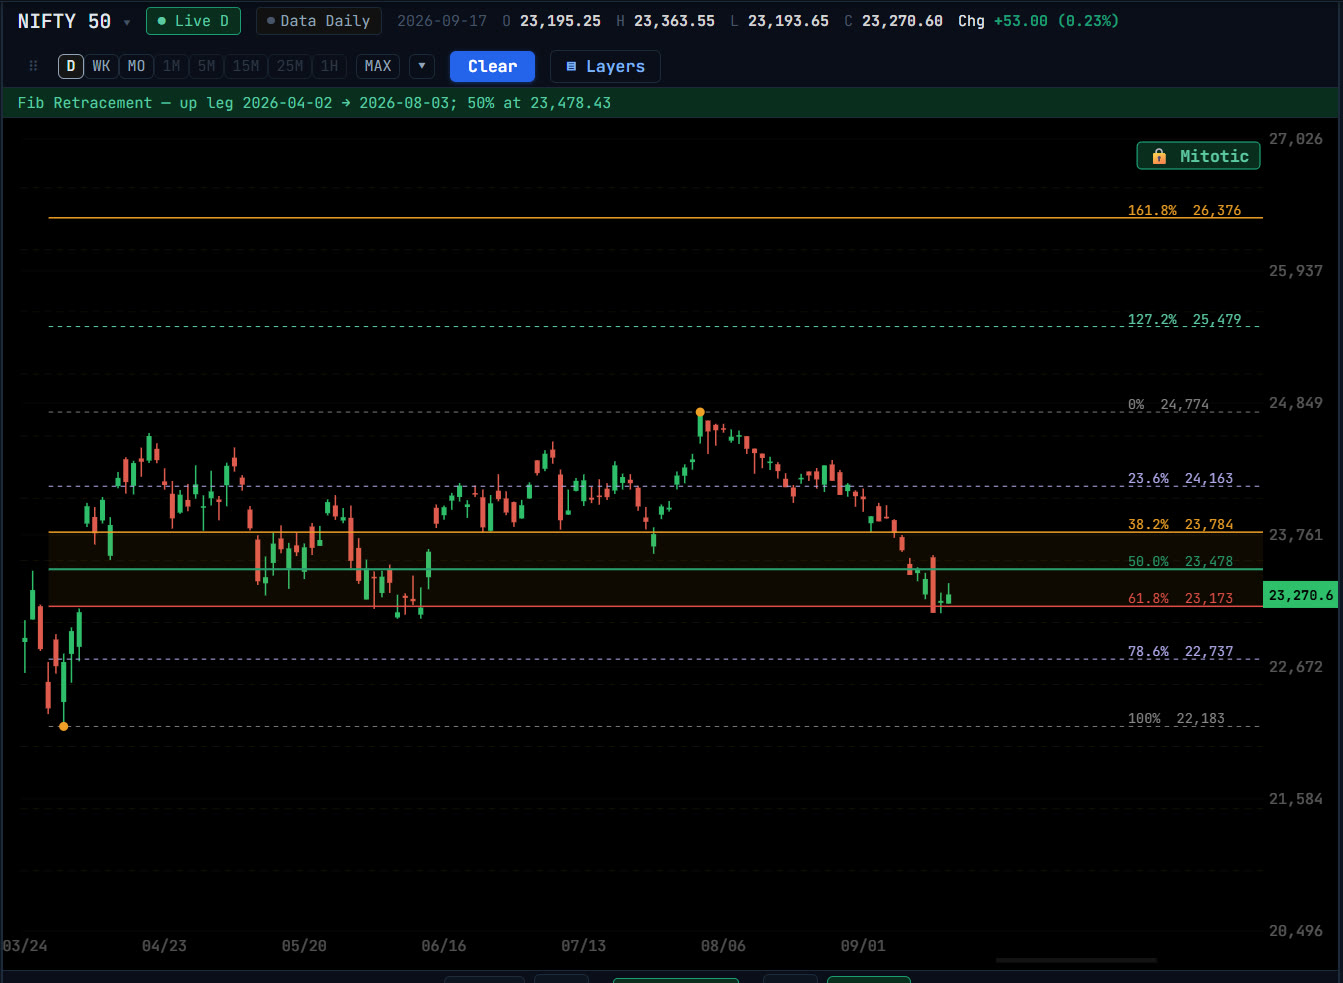
Fibonacci Tools
Fibonacci retracements, trend-based extensions, √-price extensions, time zones and time extensions, with automatic swing placement and a level scanner.
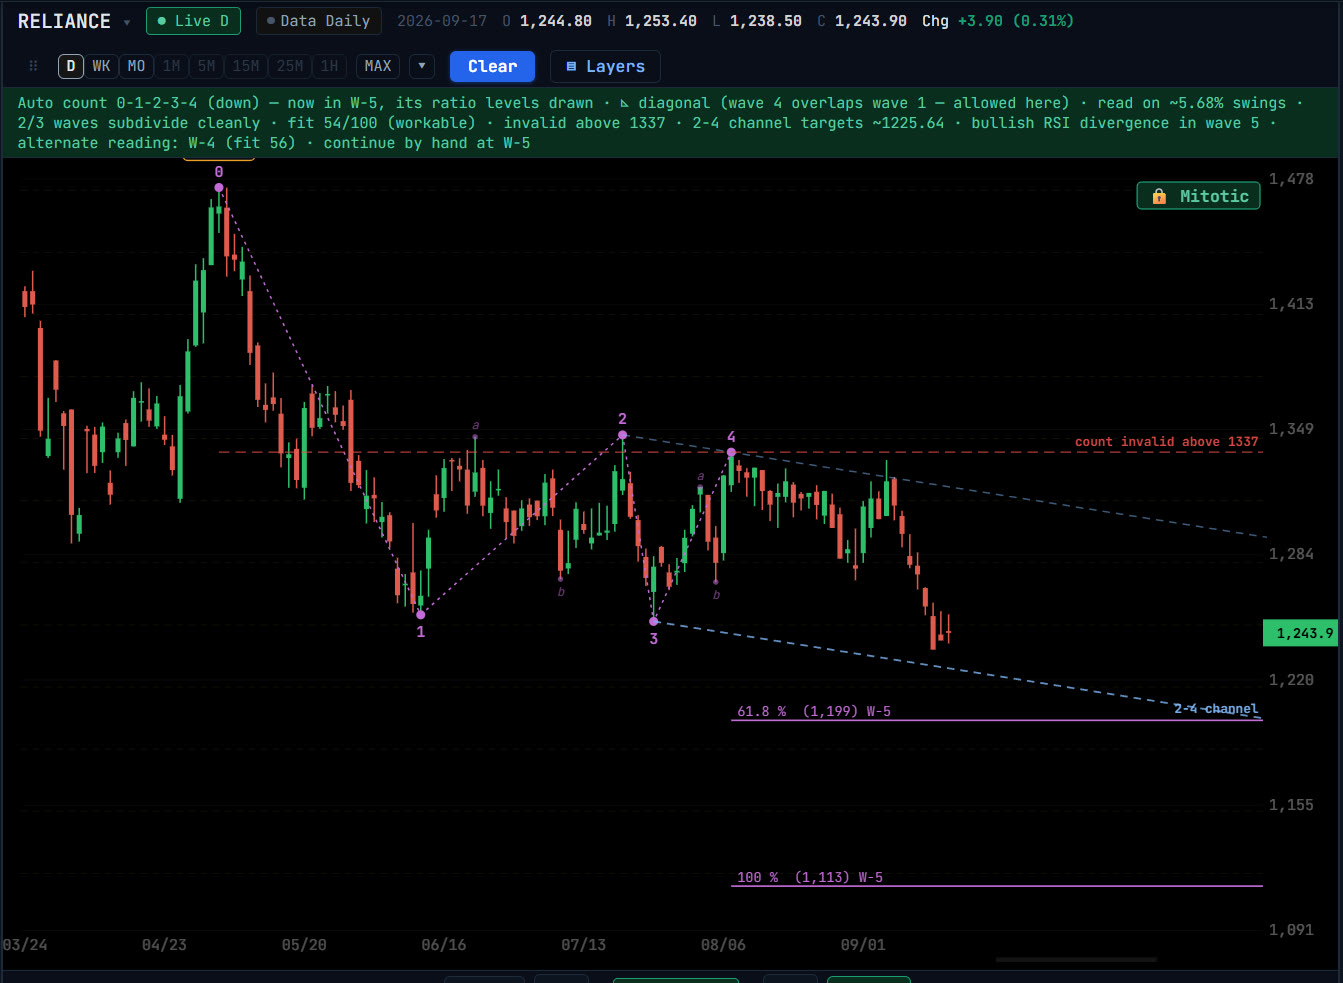
Elliott Wave
Label Elliott waves by hand or let Geometriya count them: several swing degrees tested, subdivisions checked, alternates listed, and a wave-position scanner.
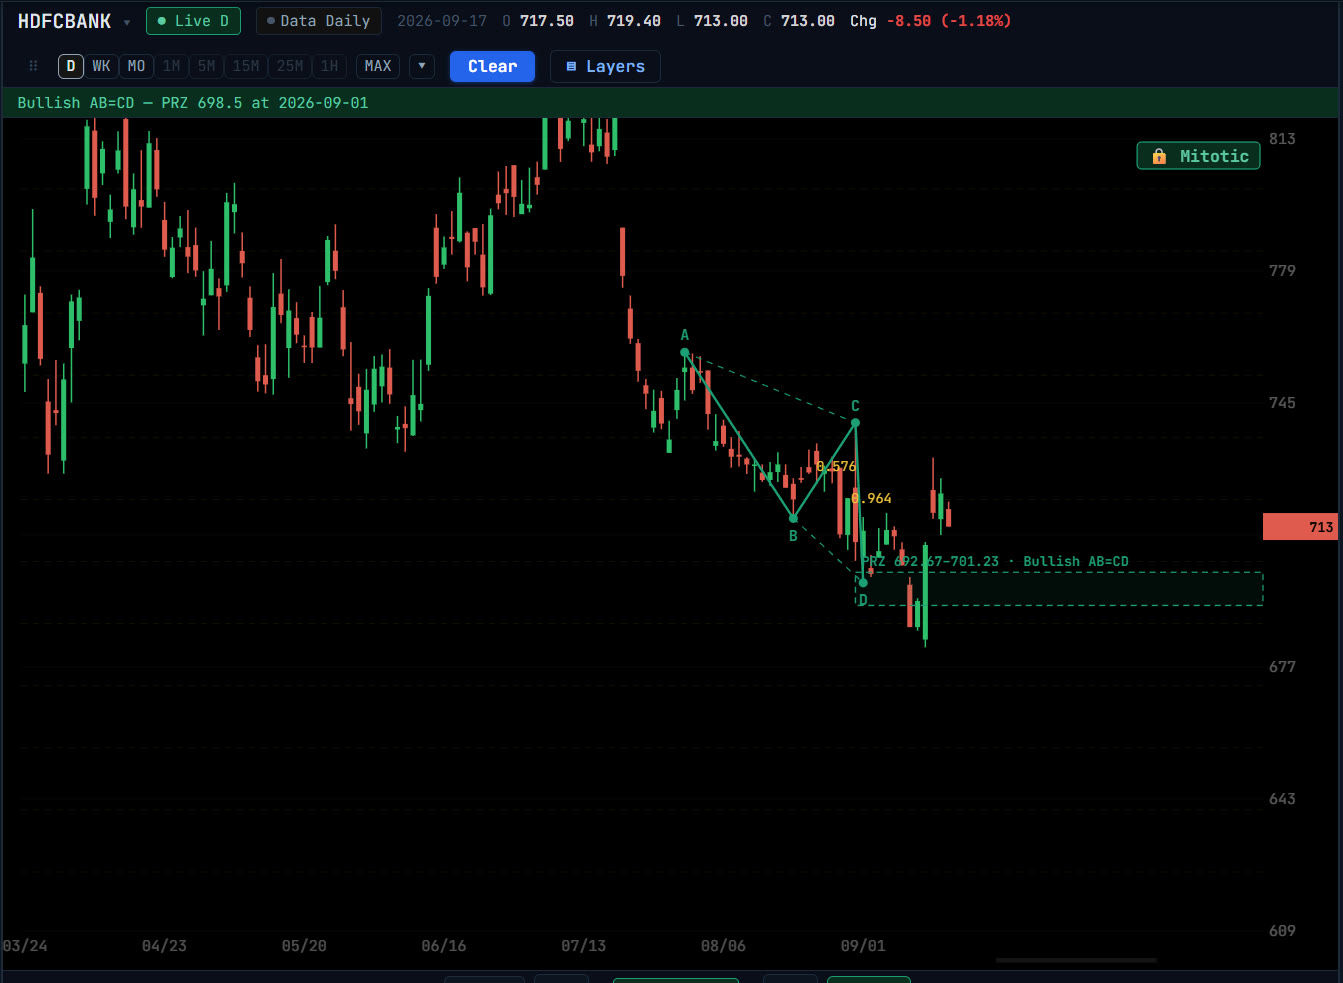
Harmonic Patterns
Detect Gartley, Bat, Butterfly, Crab, Cypher, Shark, 5-0 and AB=CD patterns, graded against their ratios, with the PRZ drawn and a scanner for forming patterns.
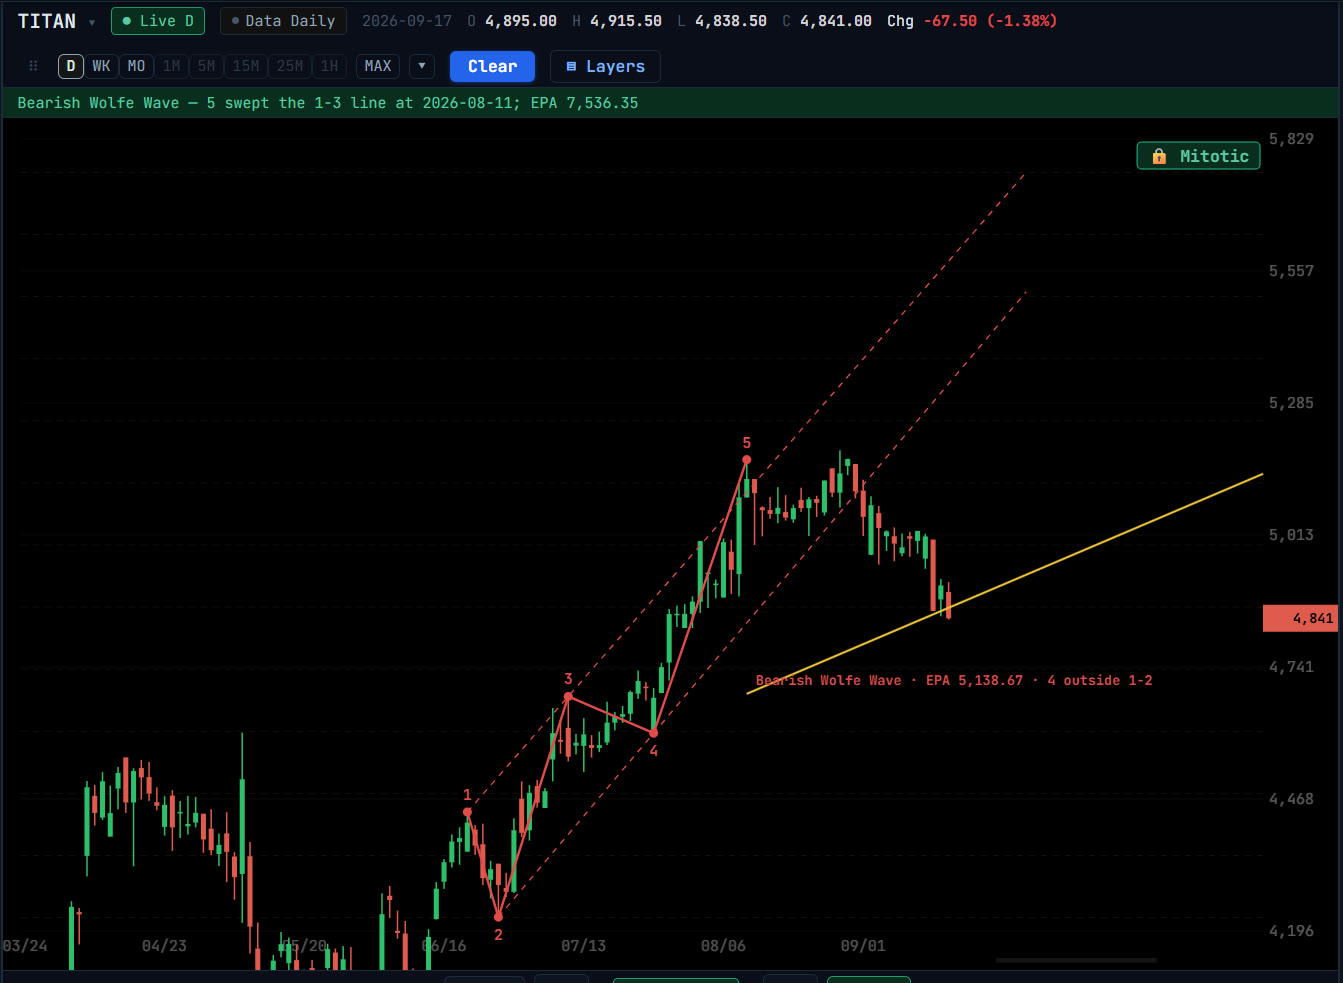
Wolfe Waves
Bill Wolfe’s five-point wedge, placed by hand or found automatically, with the 1-4 EPA target line, the ETA date and a scanner for forming waves.
Structure, volume and zones
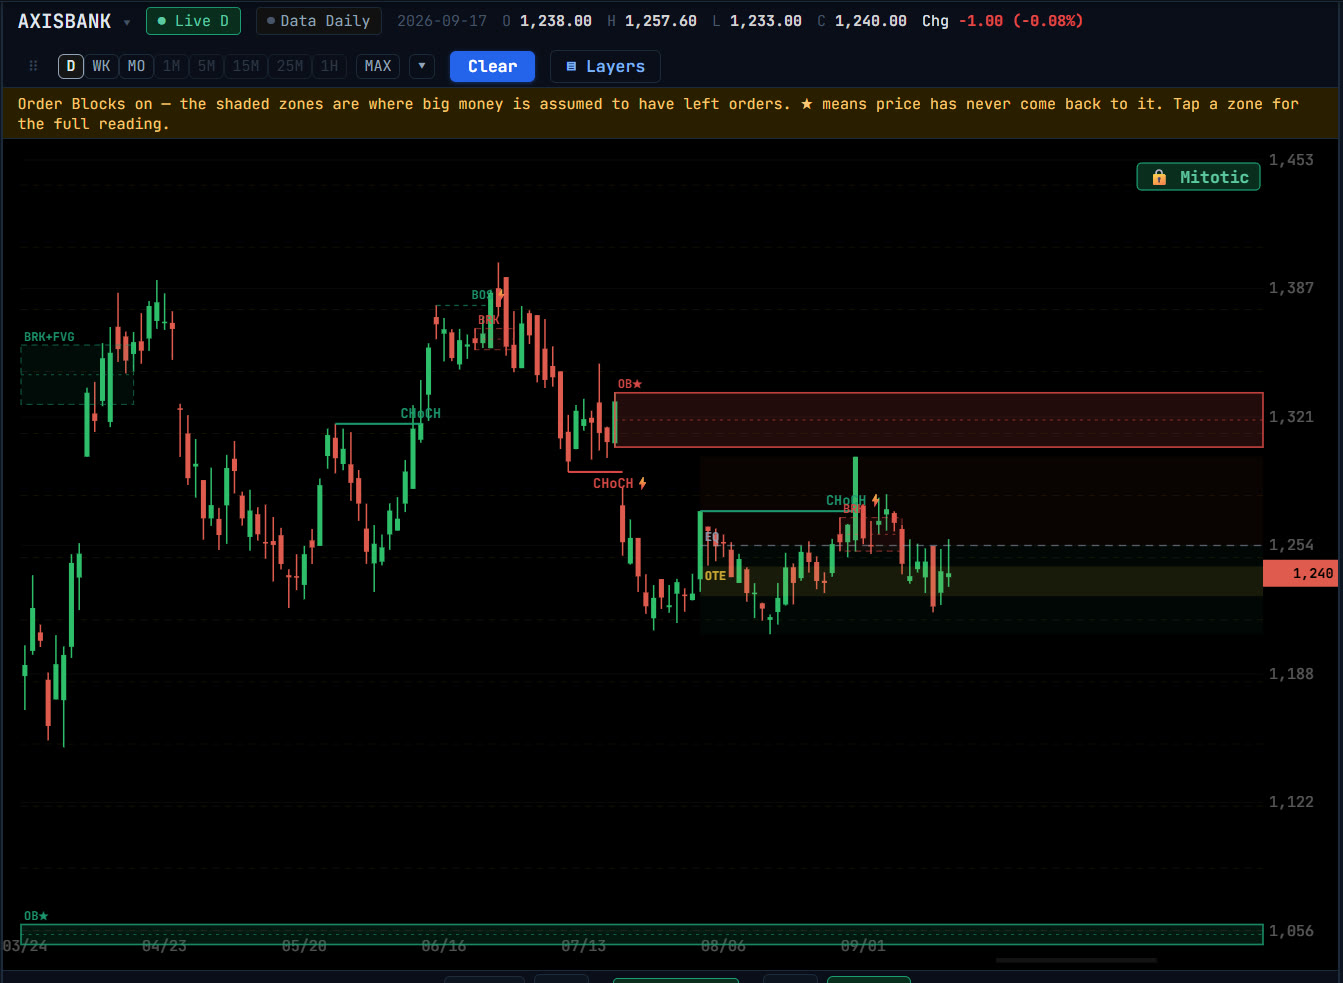
Smart Money Concepts
Smart money concepts drawn automatically: market structure breaks (BOS, CHoCH), order blocks and breakers, fair value gaps, liquidity sweeps and RSI divergence.
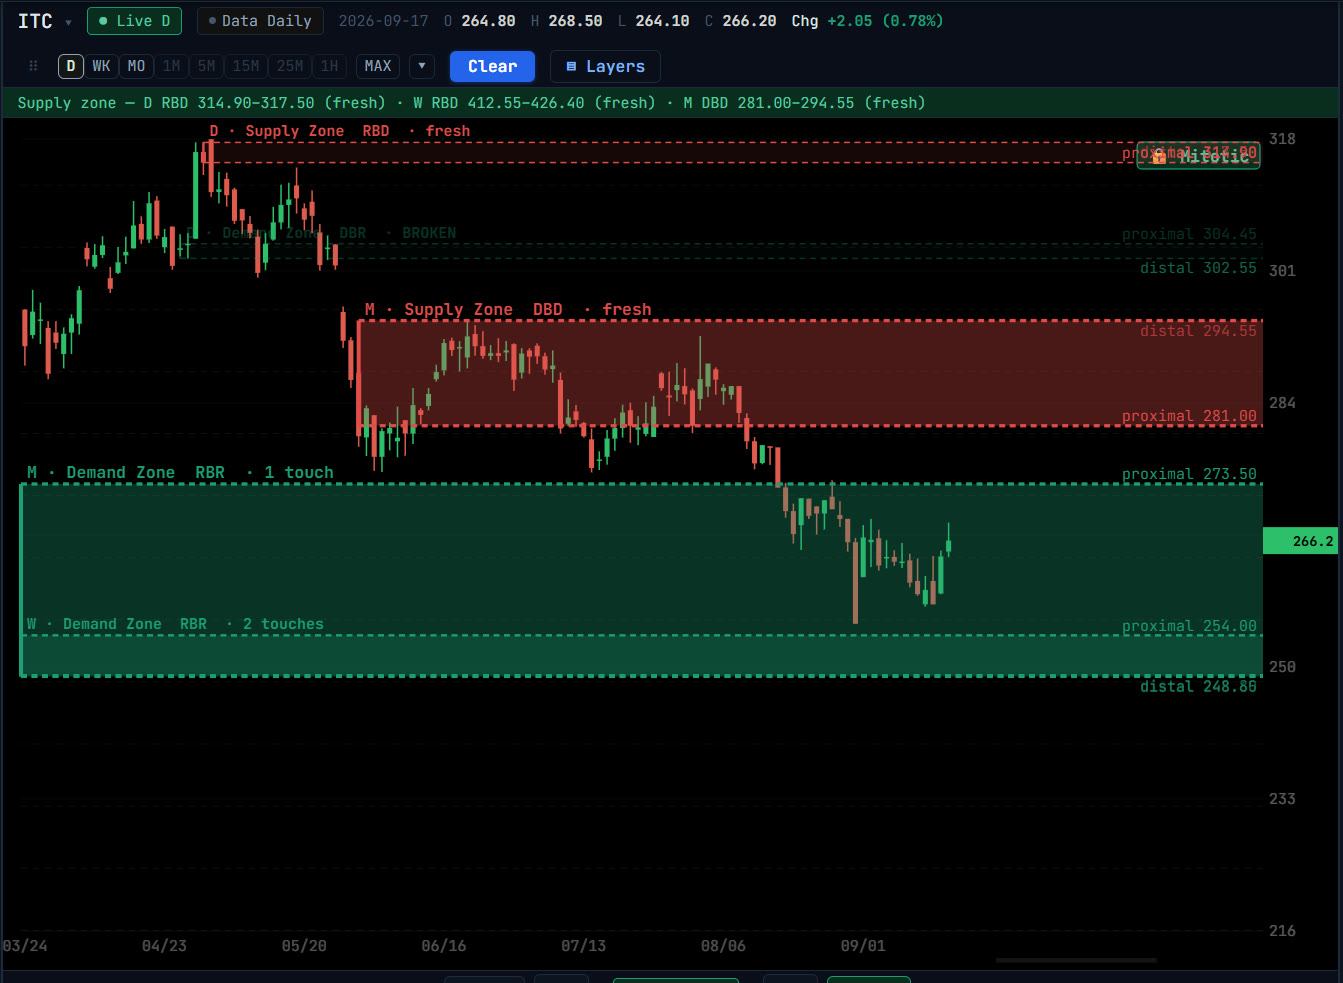
Supply & Demand Zones
Mark supply and demand zones by hand or detect the latest unbroken zone automatically from base-and-impulse structure, with adjustable detection settings.
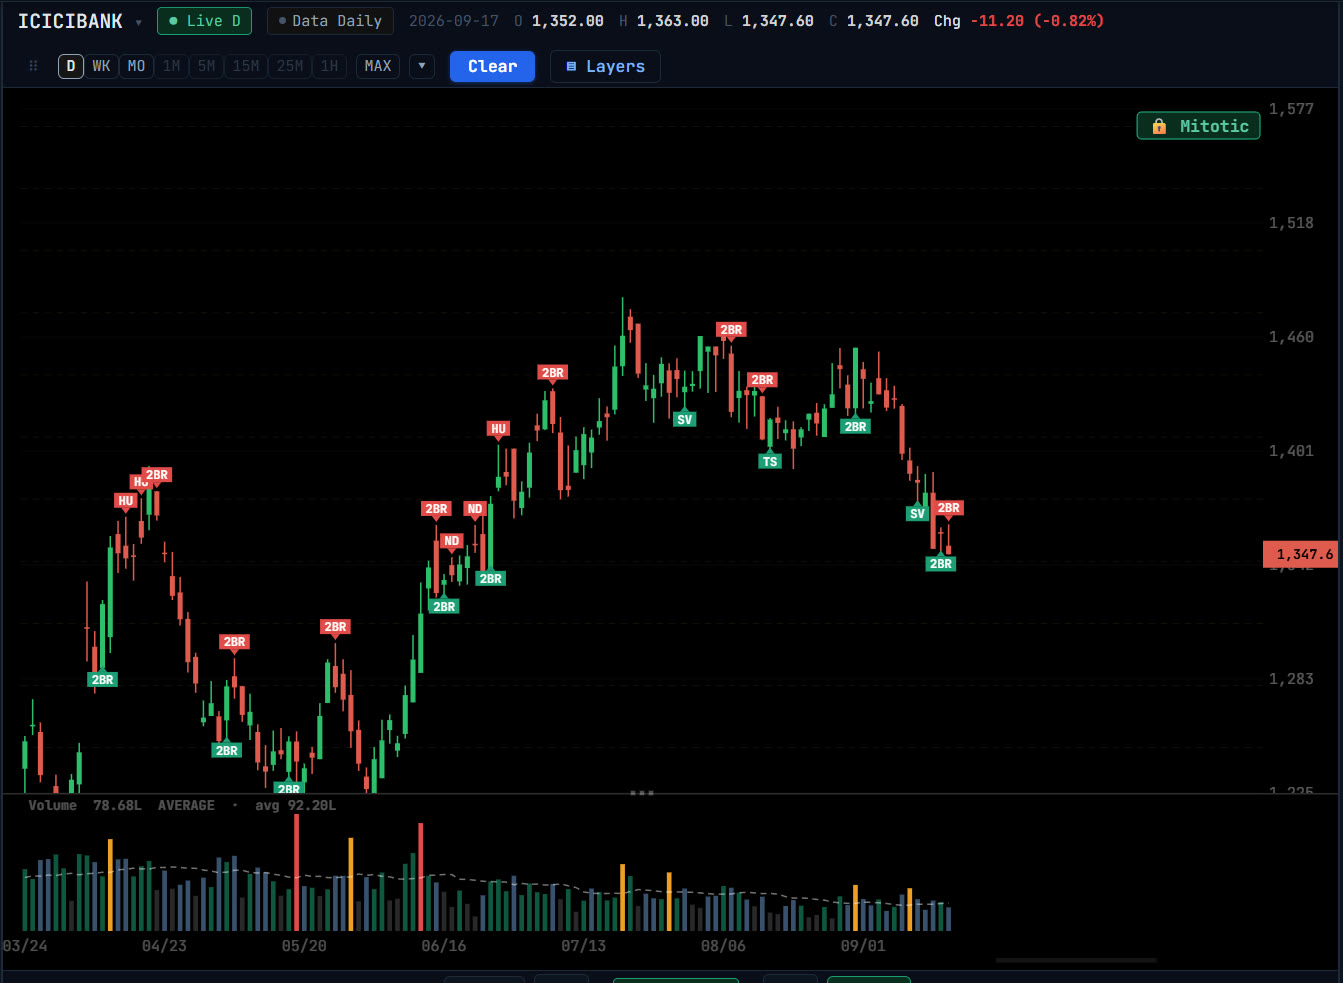
Volume Spread Analysis (VSA)
VSA reads each bar’s spread and close against its volume: selling climaxes, tests, no supply, upthrusts and no demand, marked on the chart and scanned.
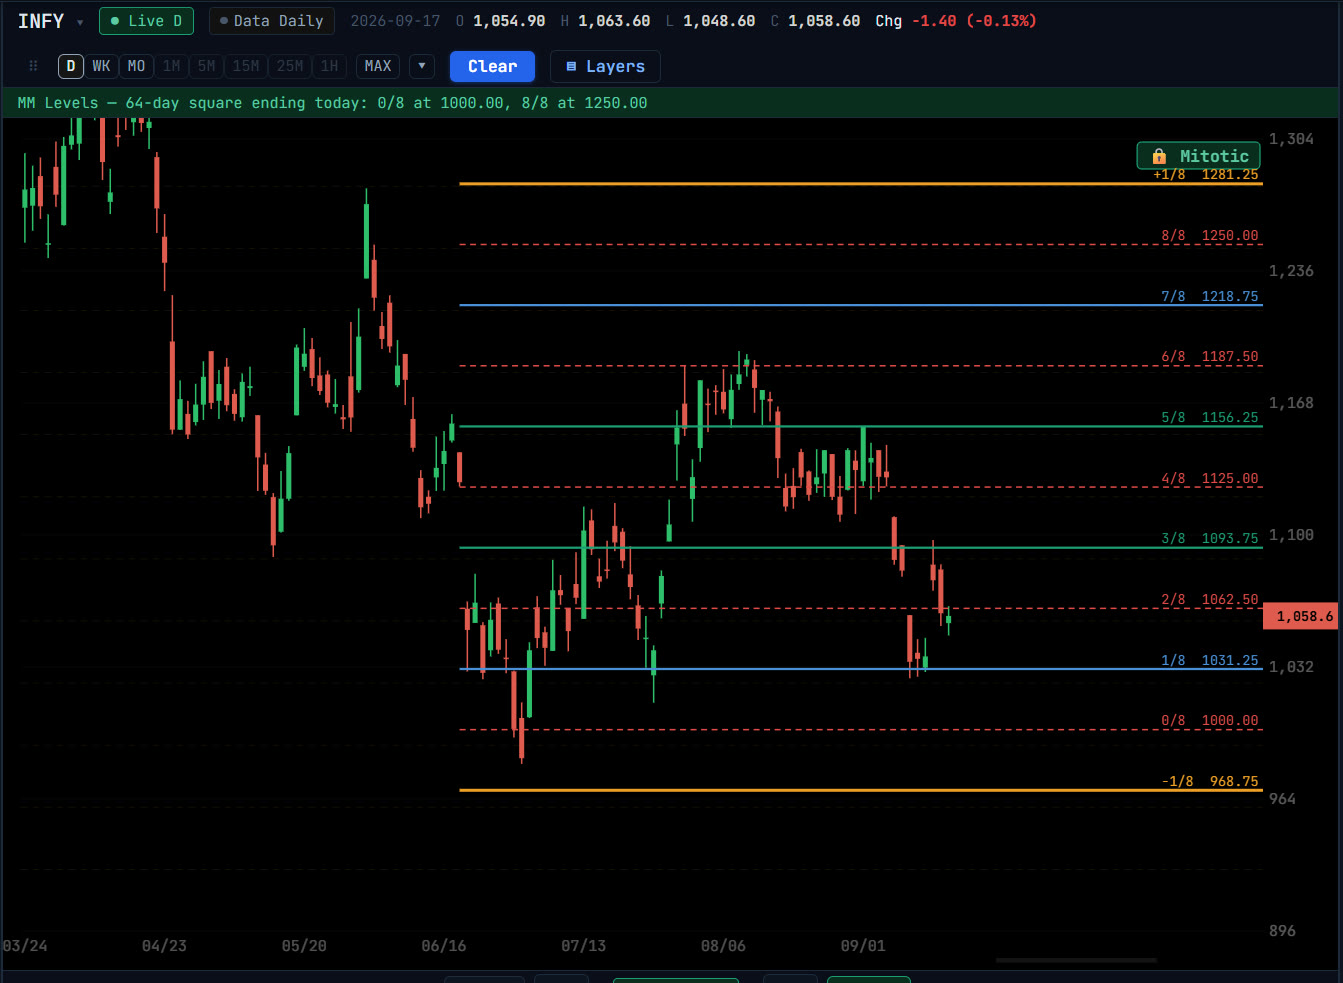
Murrey Math Levels
Murrey Math levels computed over a Square Width window: place today’s grid on the latest bar in one click, or step back through earlier squares.
Time projection
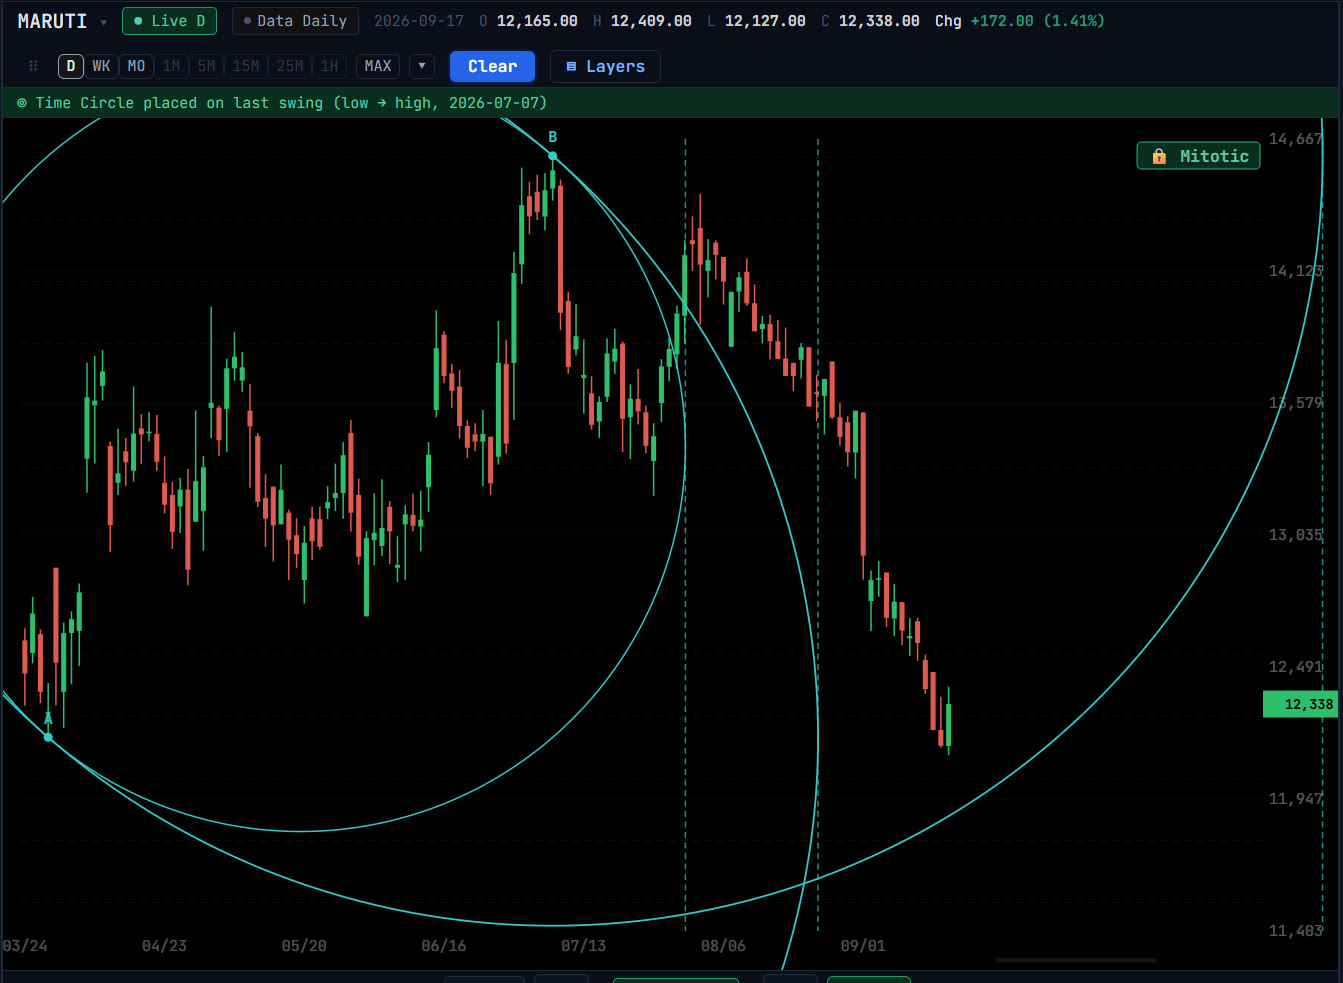
Time Projection Tools
Project future turning dates: time series, time circles, calendar-to-trading-day counts, digit-reversed bar counts, ratio time lines and mirror foldback.
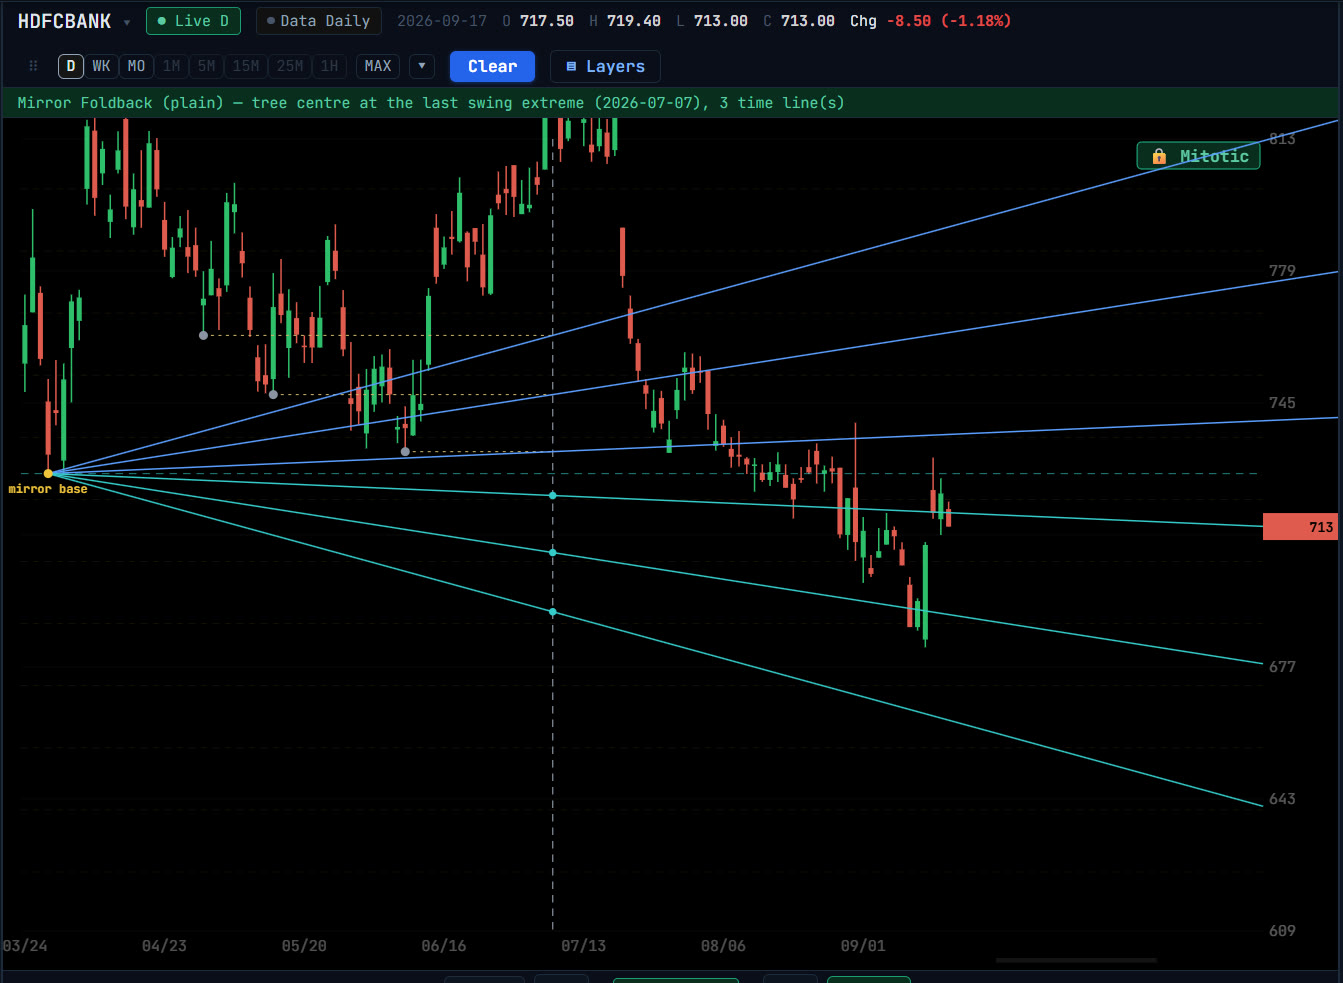
Mirror Image Foldback
Mirror Image Foldback folds the swings inside a move across its turning point, turning the past shape of the move into forward time lines and angles.
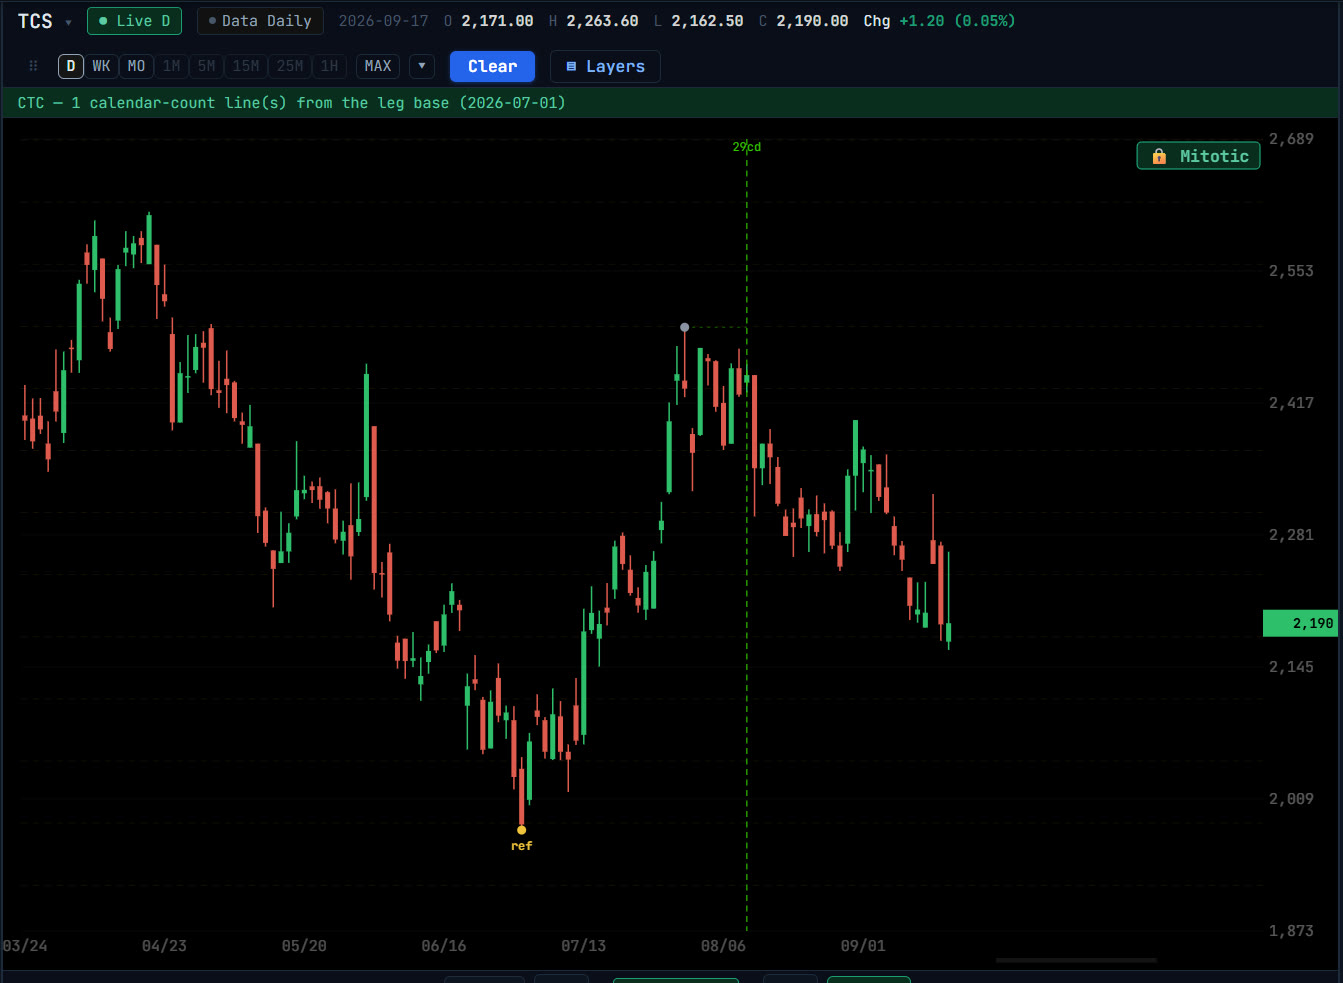
Calendar to Trading Days
Cal→Trade counts the calendar days between swings and re-lays them as trading days, projecting where a calendar cycle lands beyond the swing.
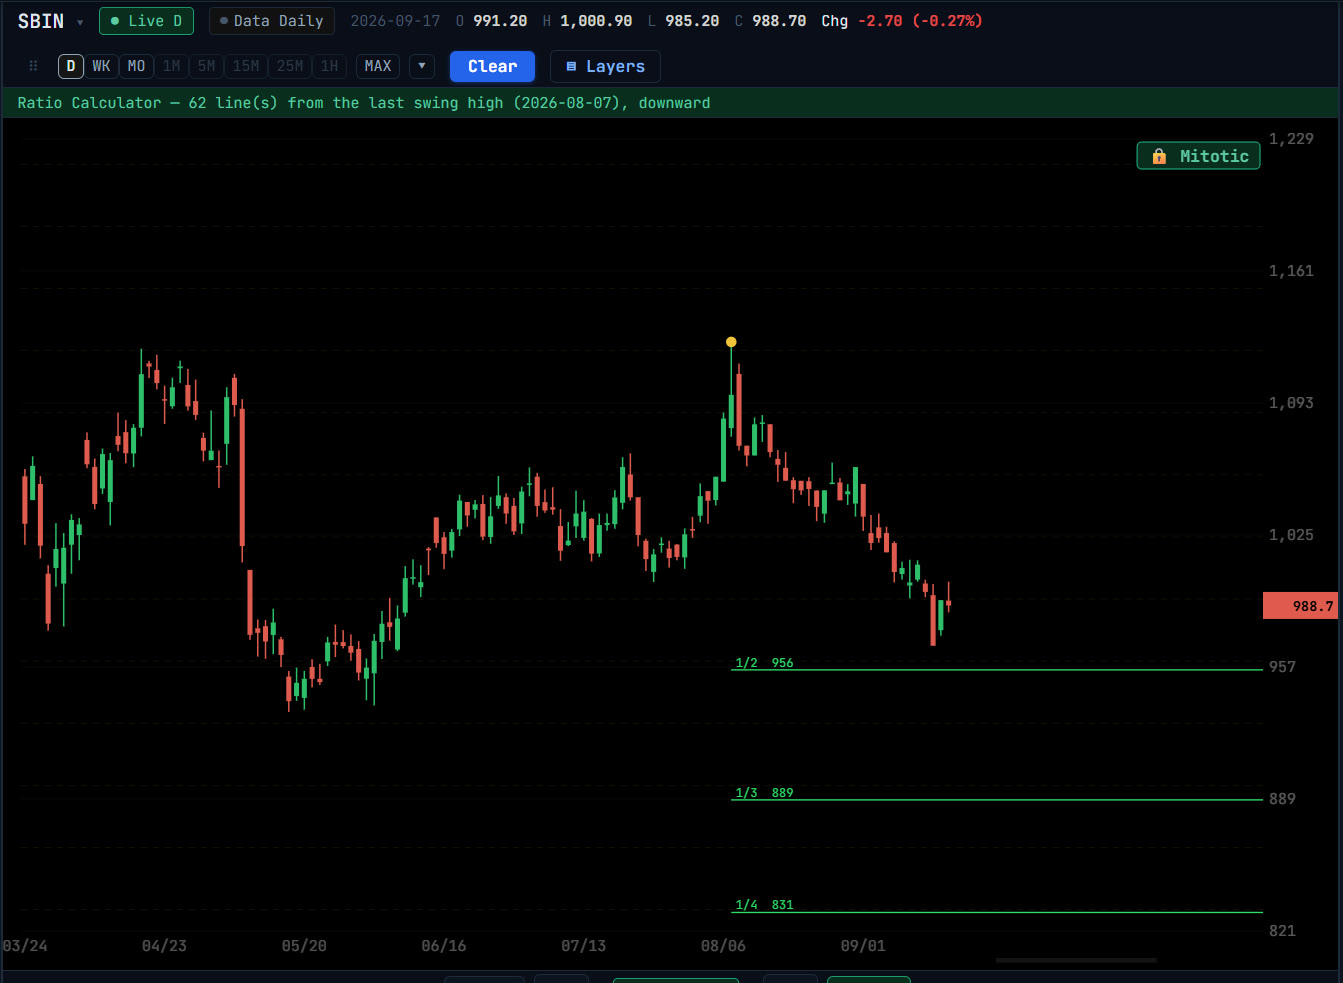
Ratio Calculator
Fire a family of ratio lines from a swing, as price levels from an extreme or as forward time lines from a leg, placed by hand or on the latest swing.
Patterns, astro and geometry
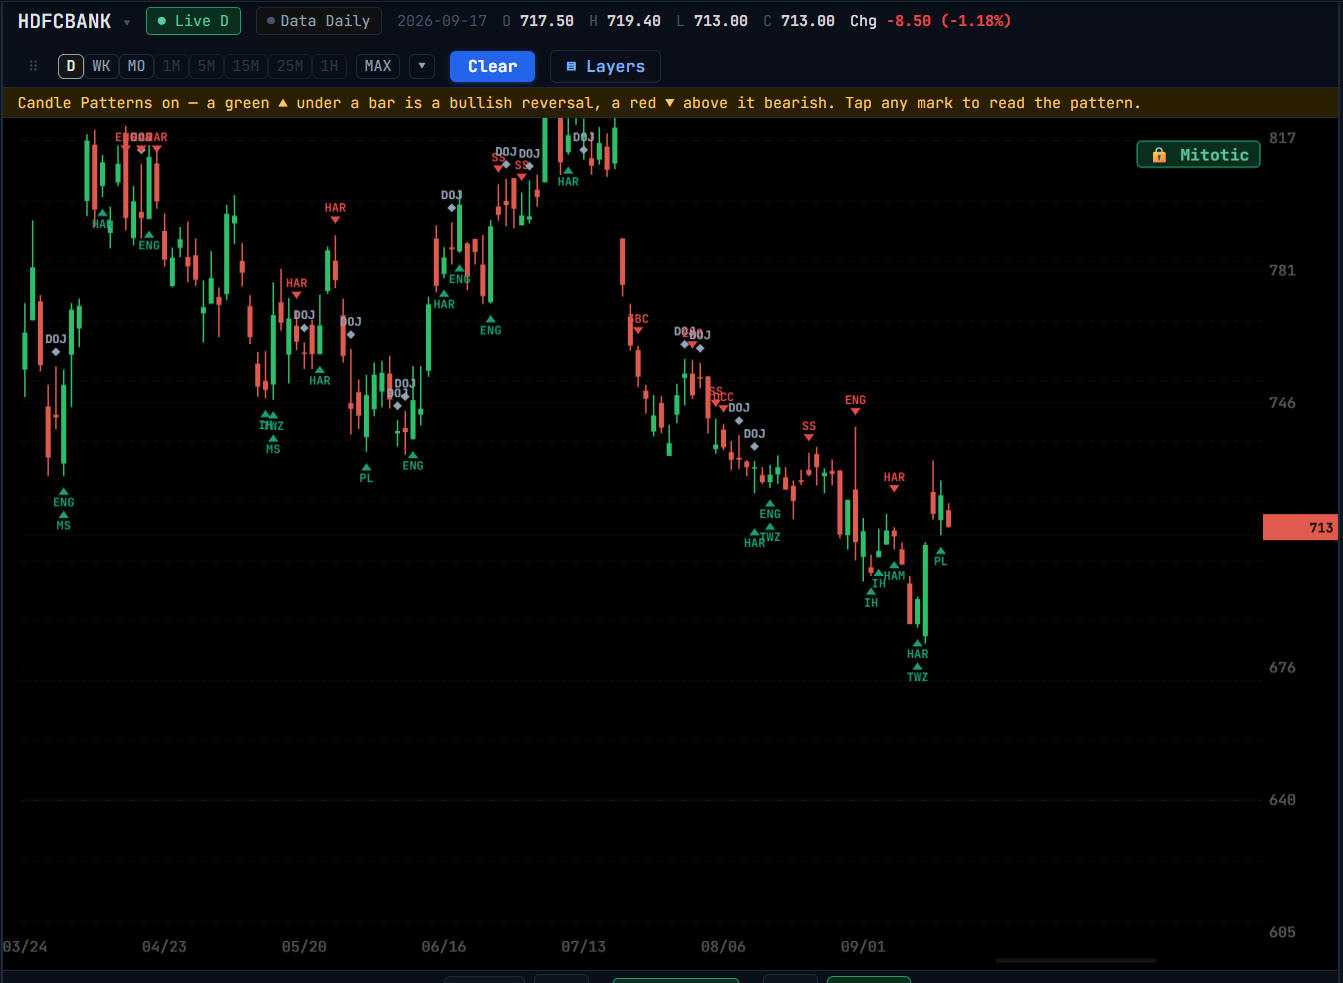
Chart & Candle Patterns
Automatic detection of 16 chart patterns, from head and shoulders to cup and handle, plus classic candlestick reversals, with measured targets.
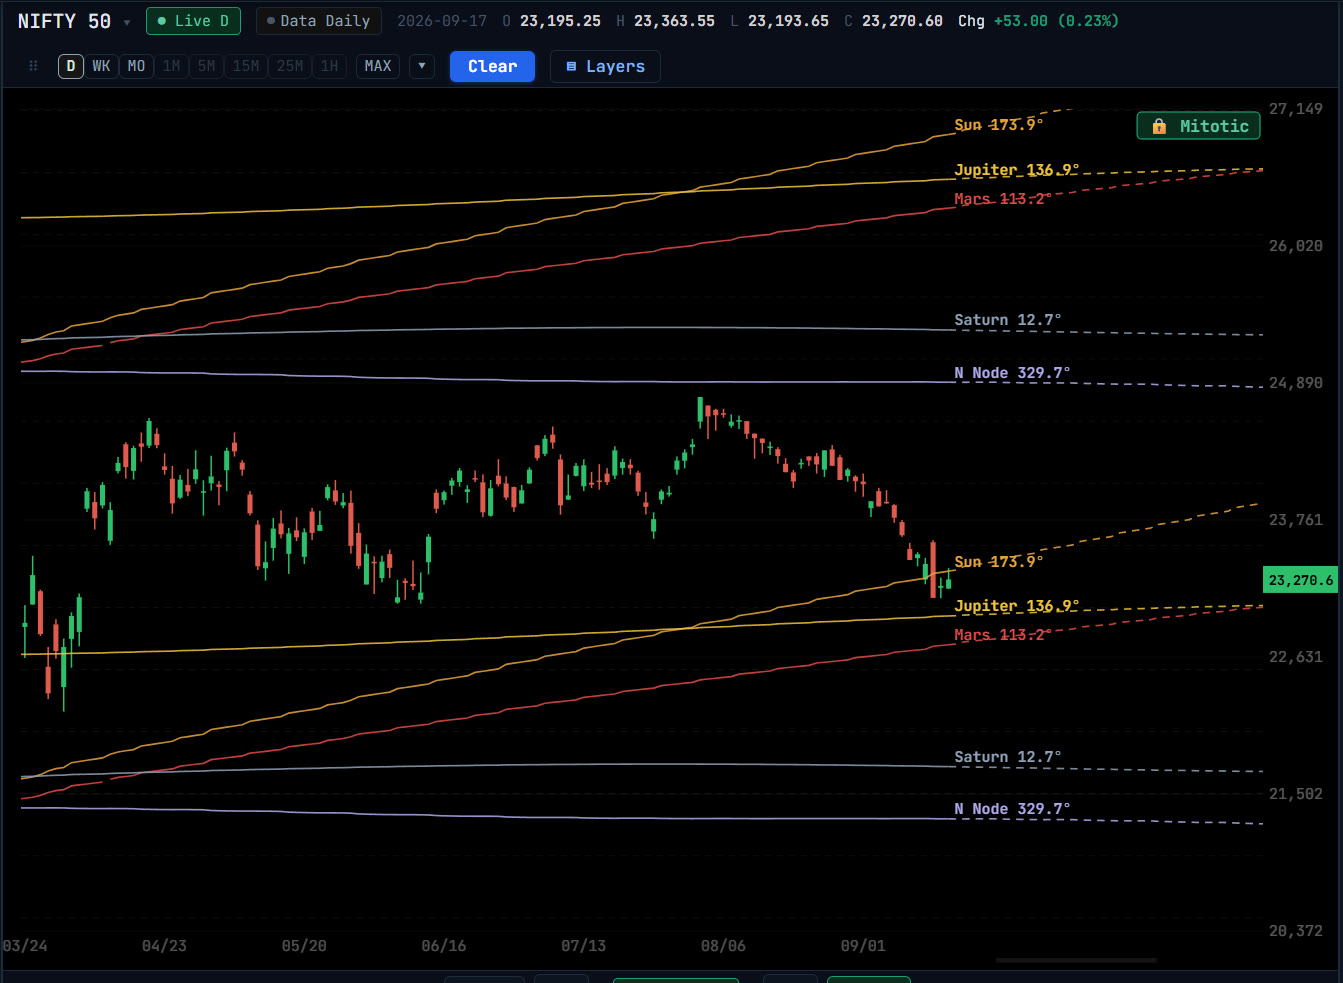
Planetary Lines
Planetary longitudes drawn as price levels on any chart, projected ahead for future dates, with each stock’s ruling planets highlighted and a scanner.
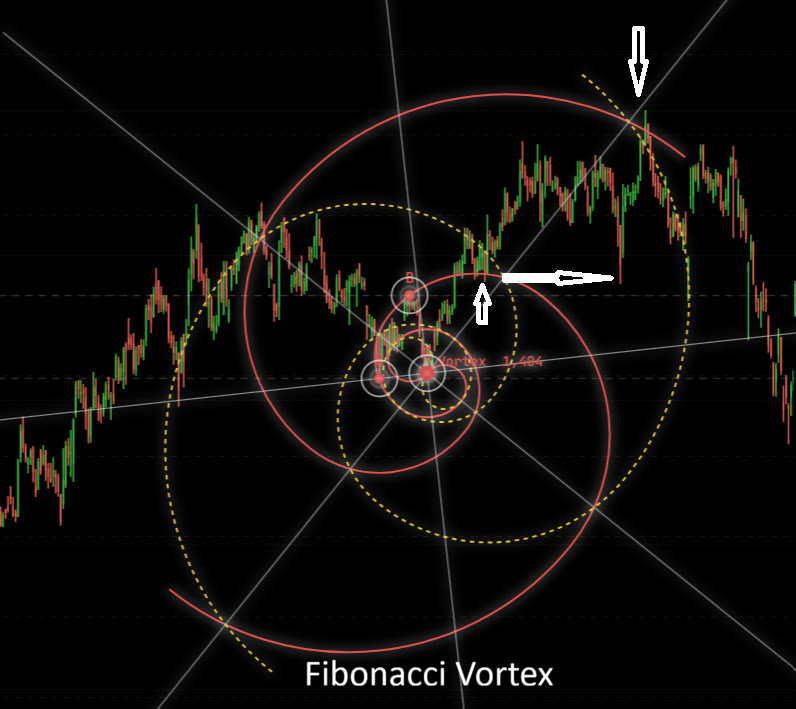
Vortex
Fibonacci spiral constructions on price charts: Vortex, Tri-Vortex at 120° and Penta-Vortex at 72°, placed from a centre, a rotation point and a scale point.
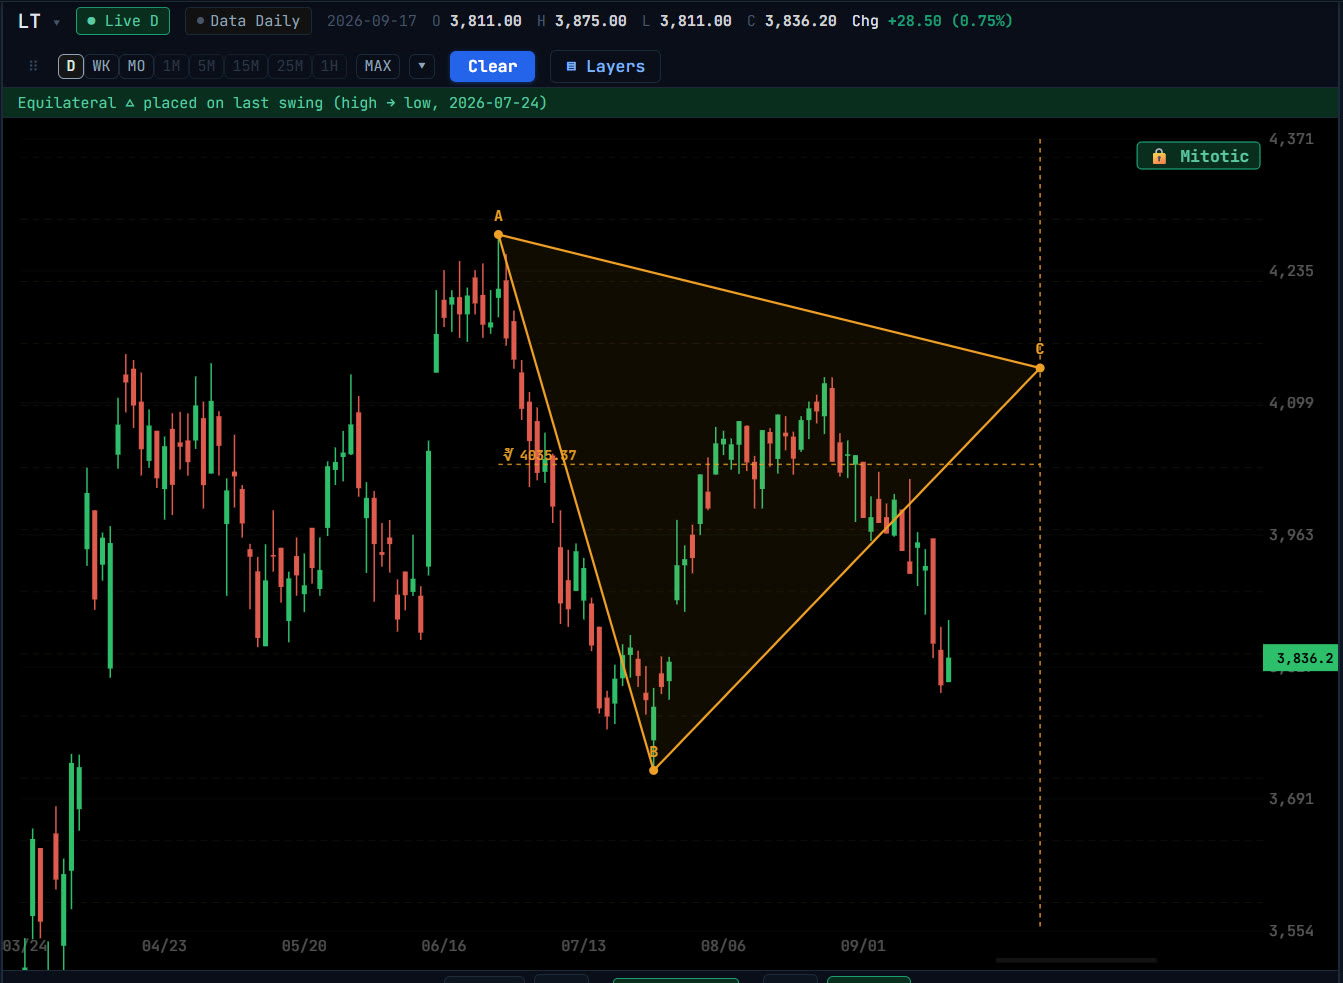
Geometric Constructions
Sacred geometry on price charts: equilateral triangles from swing legs, squares and cubes, a pentagon with its level and dates, and Metatron’s Cube.