
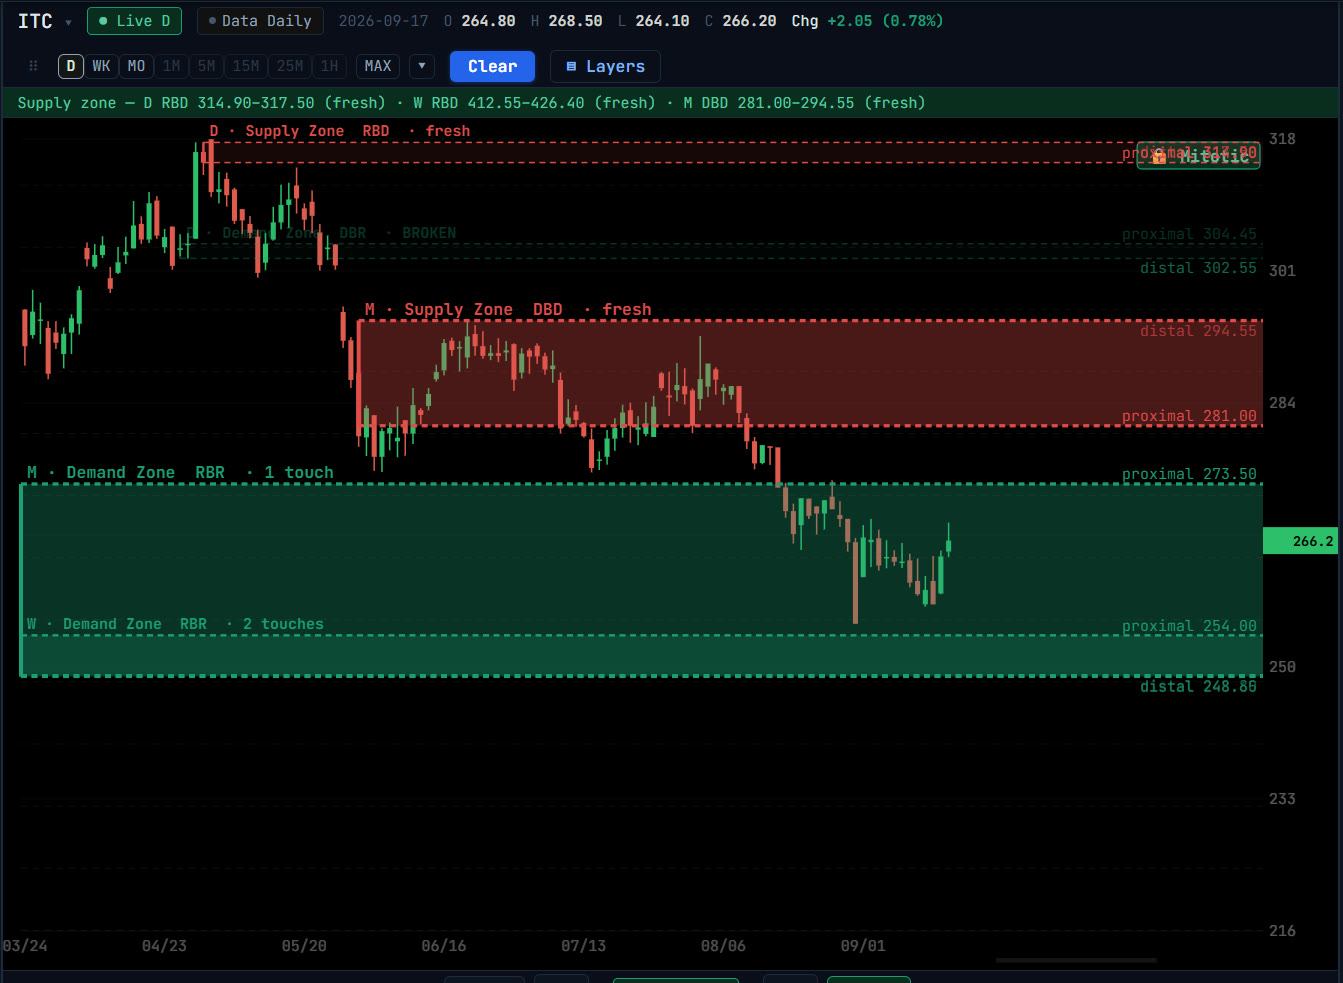
What the zones are
- Demand zone
- A base of small, indecisive candles with an impulsive move up out of it. The band buyers stepped in from.
- Supply zone
- The mirror: a base with an impulsive move down out of it, where sellers took control.
Detecting and placing
- 1Open Demand zone or Supply zone from the Zones group in Overlays.
- 2Press ⚡ to detect the most recent zone price has not yet broken, from the chart’s own base-and-impulse structure.
- 3Or click the two price levels to place a zone by hand. ◀ steps back to older zones.
What each zone shows
- Timeframe
- Zones are found on the daily (D), weekly (W) and monthly (M) charts at once, so a daily zone sitting inside a weekly one is visible on the same chart.
- Type
- How the zone formed: rally-base-rally (RBR) or drop-base-rally (DBR) for demand, rally-base-drop (RBD) or drop-base-drop (DBD) for supply.
- Fresh or touched
- Fresh means price has not returned to the zone since it formed; otherwise the number of touches is shown. A zone price has closed through is marked broken.
- Proximal and distal
- The zone’s near edge, where price meets it first, and its far edge.
Reading them
An unbroken zone is where the imbalance that launched the move may still be waiting. A return to it is the moment to look closer, ideally where another tool, such as a Gann arc, a 45° angle or a Fibonacci level, agrees.
Questions
How is a supply zone different from an order block?
A supply or demand zone is the whole base that a move launched from. An order block is narrower: the single last opposing candle before a move that broke market structure.
What makes a zone "unbroken"?
Price has not yet closed through it since it formed. Geometriya’s automatic detection only places zones that are still intact.
Related tools
Structure
Smart Money Concepts →
Smart money concepts drawn automatically: market structure breaks (BOS, CHoCH), order blocks and breakers, fair value gaps, liquidity sweeps and RSI divergence.
Patterns
Chart & Candle Patterns →
Automatic detection of 16 chart patterns, from head and shoulders to cup and handle, plus classic candlestick reversals, with measured targets.
Gann · Squares
Gann Box (Gann Square) →
Place a Gann Box from a swing low or high in one click: 5×5 or 8×8 squares, arcs, the 1×1 balance line, an angle fan and time subdivisions.