
Price patterns
Geometriya detects Double and Triple Tops and Bottoms, Head and Shoulders and its inverse, Flags, Pennants, Rising and Falling Wedges, Triangles, Rectangles, and Cup and Handle in both directions.
A pattern is marked as forming until a close crosses its neckline, and confirmed after. The target shown is the textbook measurement, not a promise. ⚡ places the most recent pattern and ◀ steps to older ones; the settings choose which patterns to look for, how closely matched tops must agree and the minimum height worth reporting.
Candlestick patterns
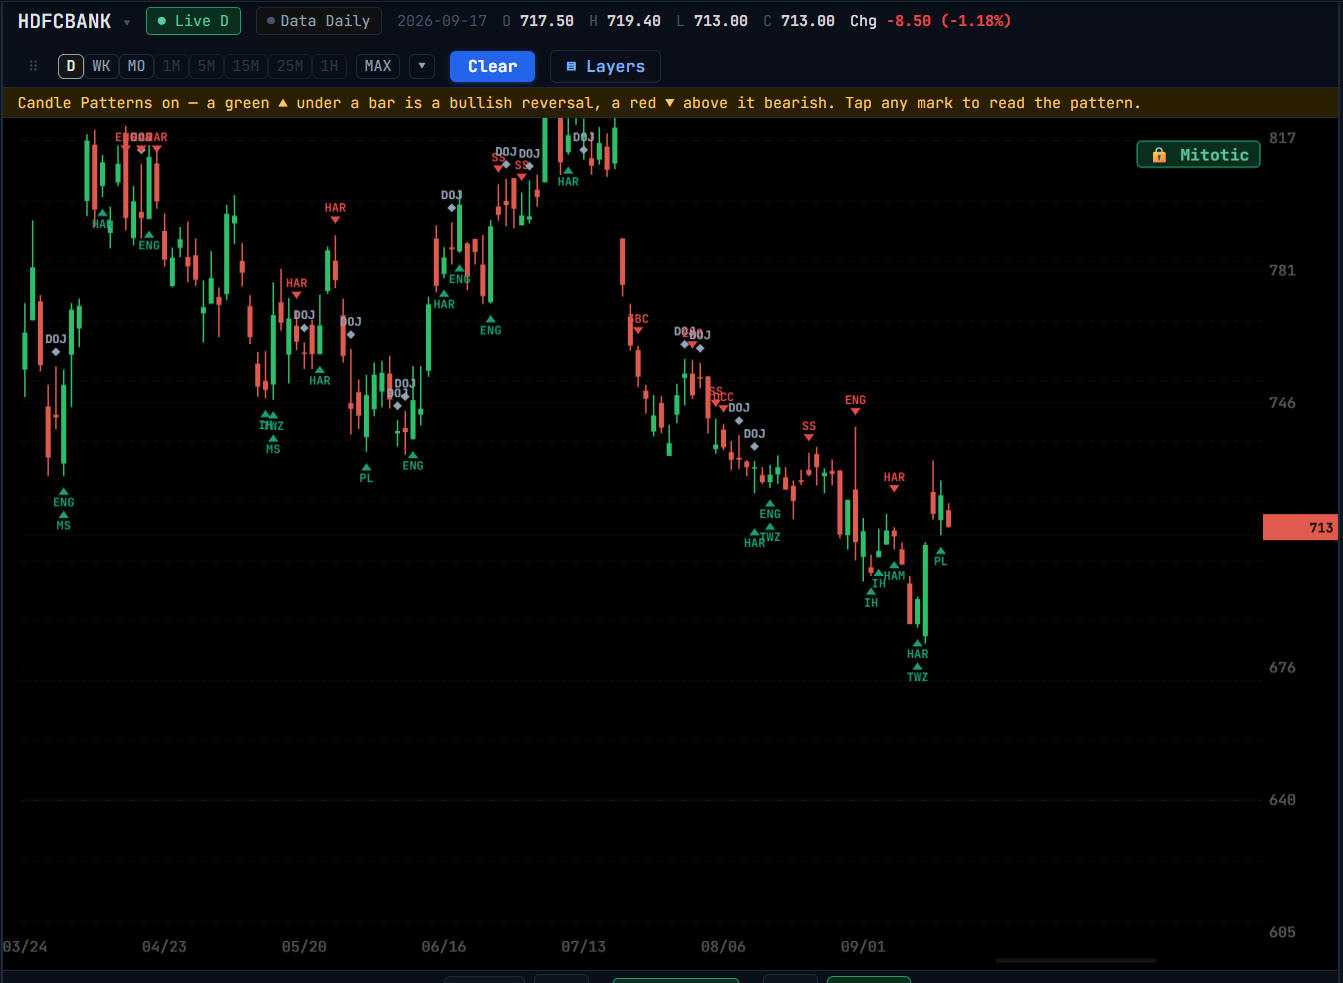
Switch on Candle Patterns and the reversals are marked on the bars: Doji, Hammer, Engulfing, Harami, Piercing Line, Morning and Evening Star, Three Soldiers and Three Crows, and Tweezers. Bullish patterns show a green ▲ under the bar, bearish ones a red ▼ above it, and a Doji a grey diamond.
A reversal only means something against the move it reverses, and that is built in: a Hammer is only marked after a fall and a Hanging Man only after a rise. The settings define what counts as a Doji body, a long shadow and a prior trend.
Using them well
Patterns are candidates, not signals. The ones worth attention are those that form at a level another method already marks, such as a Gann arc, a Fibonacci level or a supply or demand zone.
Questions
Which chart patterns are detected?
Double and Triple Tops and Bottoms, Head and Shoulders and Inverse, Flags, Pennants, Rising and Falling Wedges, Triangles, Rectangles, and Cup and Handle both ways.
When is a pattern confirmed?
When a candle closes beyond its neckline. Until then it is shown as forming.