
One structure, different ratios
Every harmonic pattern is the same five alternating swings, X, A, B, C and D. What separates them is the ratio each leg must hold. A Gartley’s D retraces XA by 0.786, a Bat’s by 0.886, a Crab’s extends to 1.618, and a Cypher measures D from XC instead. The direction of X to A makes the pattern bullish or bearish.
Placing and grading
- 1Open Harmonics from Overlays and click X, A, B, C and D in order, alternating highs and lows.
- 2Geometriya grades your clicks against the whole family and names the best match. Any leg that fails its ratio is printed in red.
- 3Or press ⚡ to find the most recent run of swings that passes any pattern’s ratios, and ◀ to step to older ones.
Reading the PRZ
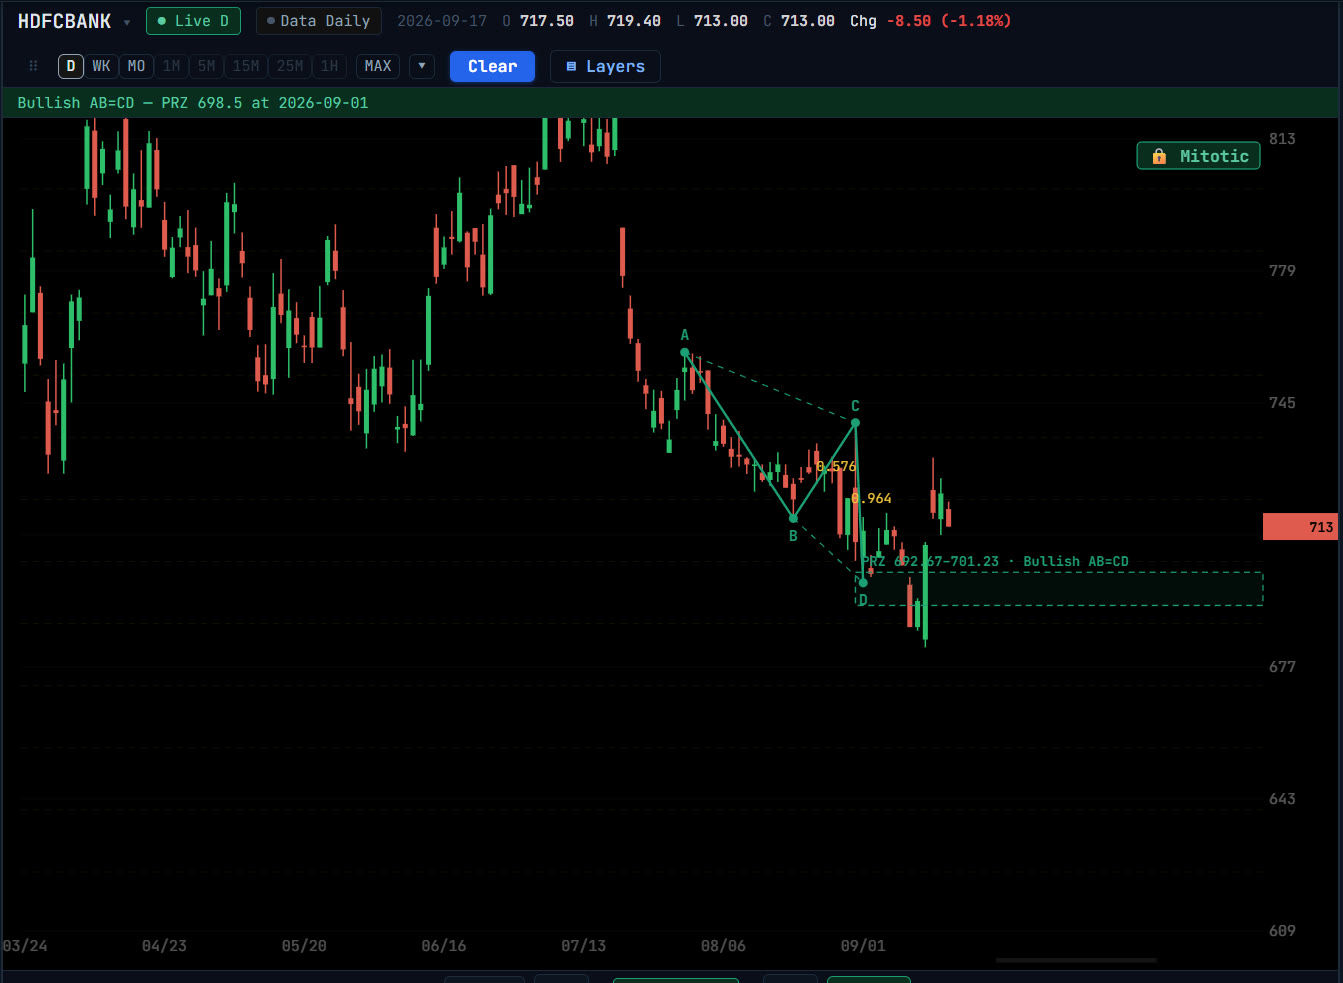
The box at D is the Potential Reversal Zone: the pattern’s ratio range mapped onto price, the zone the pattern says price turns from. The tolerance setting is the quality dial; tighter tolerance means fewer patterns, but cleaner ones.
Scanning forming patterns
The harmonic scanner also watches patterns still forming, where X, A, B and C are already in ratio and D is projected ahead. A Fresh filter stops a pattern that completed months ago from lingering on the list as a setup.
Questions
Which harmonic patterns are included?
Gartley, Bat, Alt Bat, Butterfly, Crab, Deep Crab, Cypher, Shark, 5-0 and AB=CD.
What is the PRZ?
The Potential Reversal Zone: the price range at point D where the pattern’s ratios converge, and where the pattern expects a turn.
Can I find patterns before D completes?
Yes. The scanner lists forming patterns with D projected ahead, so you can watch price approach the zone.