
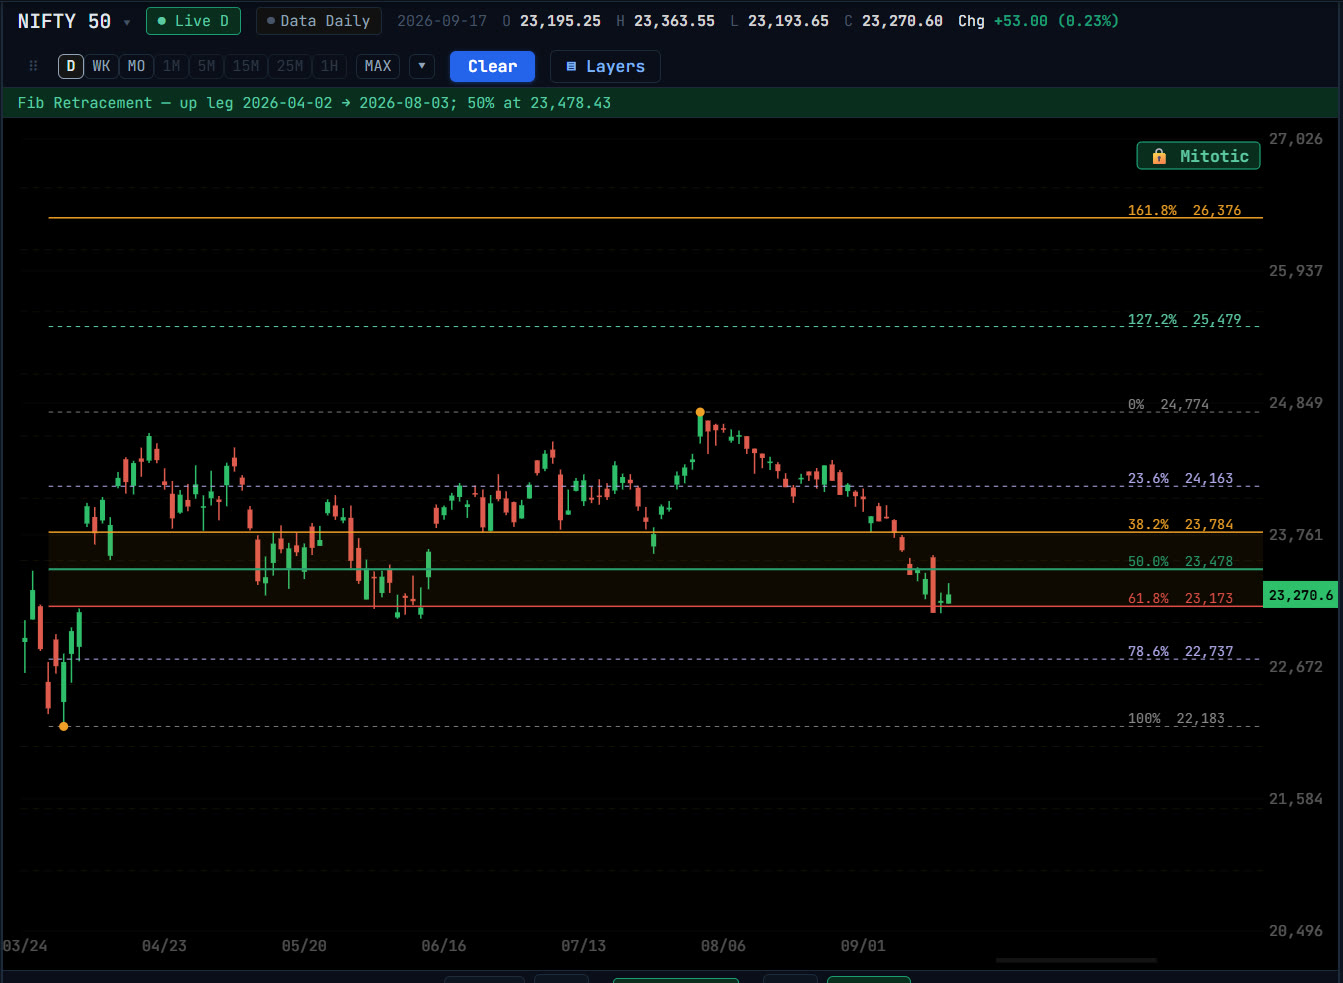
Fibonacci retracement
Click where a move started and where it finished. Geometriya draws the retracement levels at 23.6%, 38.2%, 50%, 61.8% and 78.6% of the move, with 0% on the finish and 100% back at the start, plus extensions beyond it from 127.2% and 161.8% outward.
A pullback into the 38.2% to 61.8% band is where moves usually pause; past 100% the extensions carry on in the move’s own direction as targets.
⚡ takes the last confirmed swing for you, and ◀ steps one swing further back per click, alternating up-legs and down-legs the way price does.
Extensions
- Fib Extension
- The three-click, trend-based extension: the height of the A→B move is projected from C at Fibonacci ratios, in the move’s direction.
- Fib √ Extension
- Extensions taken on the square root of price rather than price, at 0.618, 1.618, 2.618, 4.236, 6.857 and 11.08. Useful where plain extensions overshoot on high-priced stocks.
Fibonacci in time
- Fib Time Zones
- Vertical lines at 1, 2, 3, 5, 8, 13 … units from an origin. Click A and B to set one unit; click both on the same bar for the classic one-bar unit.
- Fib Time Extension
- The A→B bar span projected forward from C as vertical lines at Fibonacci ratios, the time equivalent of the trend-based extension.
Scanning for Fibonacci levels
The retracement scanner runs across a watchlist or index and reports which level each stock’s close is sitting on today.
Questions
Which Fibonacci levels does Geometriya draw?
Retracements at 23.6%, 38.2%, 50%, 61.8% and 78.6%, and extensions beyond the move starting at 127.2% and 161.8%. The square-root extension works at 0.618, 1.618, 2.618, 4.236, 6.857 and 11.08 of √price.
Is 50% a Fibonacci ratio?
Not strictly, but it is a standard retracement level that traders watch alongside 38.2% and 61.8%, so it is drawn with them.
Can Fibonacci be applied to time?
Yes. Fib Time Zones and Fib Time Extension project Fibonacci counts forward in bars, to mark dates rather than prices.