
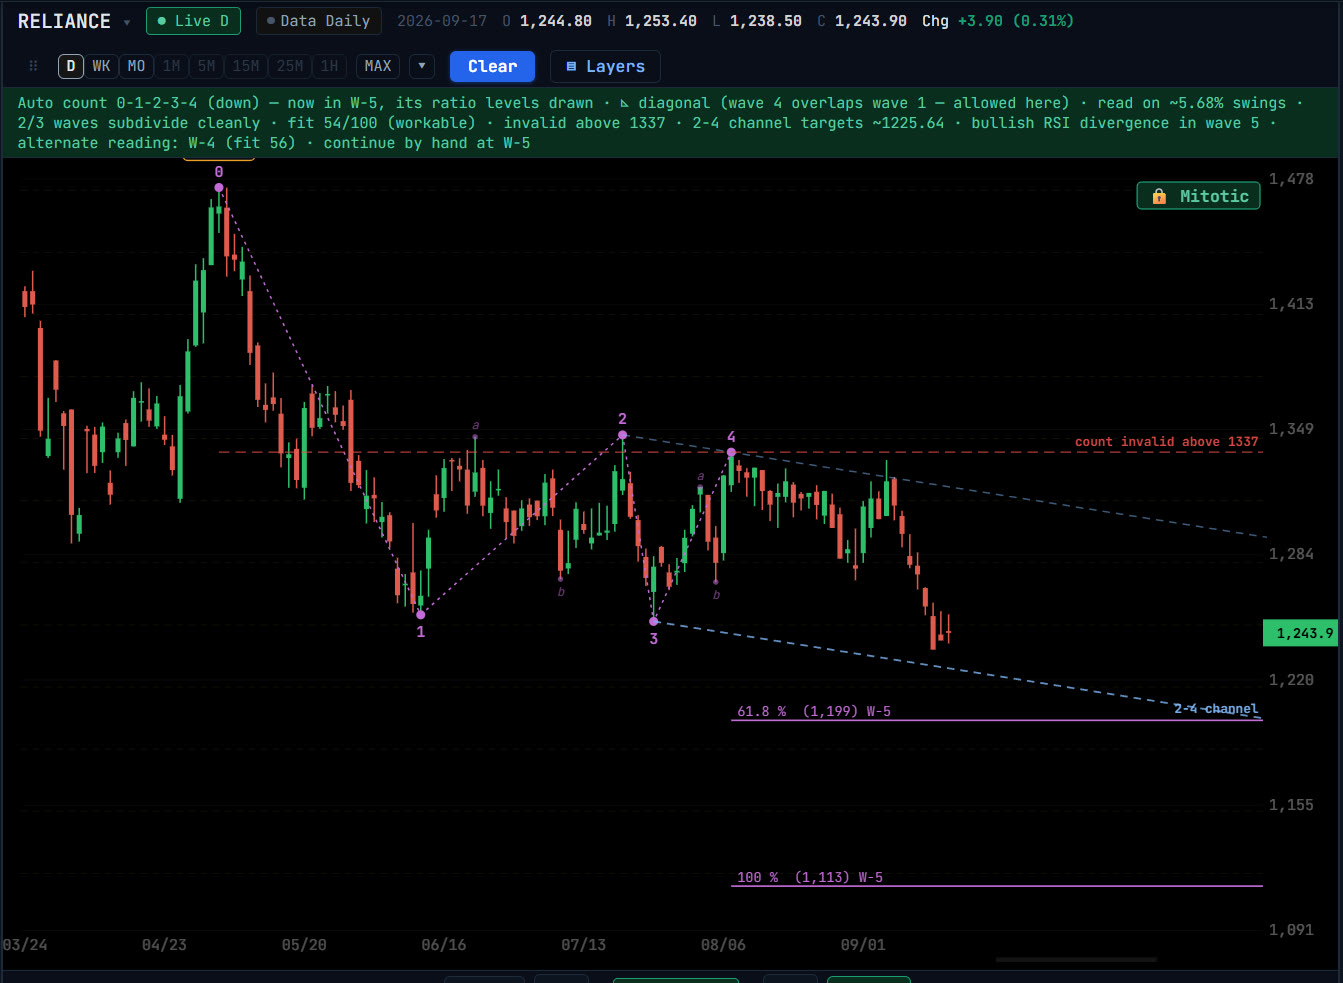
Counting by hand
Open Elliot Wave from Overlays to arm the chart, then click the swings in order: 0, 1, 2 and on through the correction A-B-C. On a fresh chart it starts at wave 2; on a chart that already has a count it carries on where you left off.
For the wave in progress it draws the ratio levels that wave is expected to respect.
The automatic count
Press ⚡ and Geometriya tries several degrees of swing, each scaled to how much that stock moves in a day. It keeps the count whose wave proportions fit best and whose waves break down into the smaller legs Elliott’s rules expect.
Those smaller legs are labelled i–iv and a–b, so the count can be checked rather than taken on trust. A hint says which degree it read, how many waves subdivide cleanly and how well the count fits, and the other readings the same swings support are listed as alternates.
The count also draws the level above or below which it would be invalid, the 2-4 channel with its target for wave 5, and the ratio levels for the wave in progress. It recognises diagonals, where wave 4 is allowed to overlap wave 1, and notes RSI divergence inside a fifth wave.
Scanning by wave
The Elliott scanner filters a watchlist or index by the wave each stock is in right now, from W-1 to W-C, so you can list, for example, every stock currently in a third wave.
Questions
How accurate is an automatic Elliott Wave count?
Any Elliott count is an interpretation, and the same swings can support more than one. That is why Geometriya shows the subdivisions it relied on and lists the alternate counts instead of presenting one answer as certain.
Which waves does it label?
The impulse 0-1-2-3-4-5 and the correction A-B-C, with the smaller i–iv and a–b legs inside them.
Does it work on intraday charts?
The count runs on whatever timeframe the chart shows. The degree it chooses is scaled to that stock’s own daily movement.