
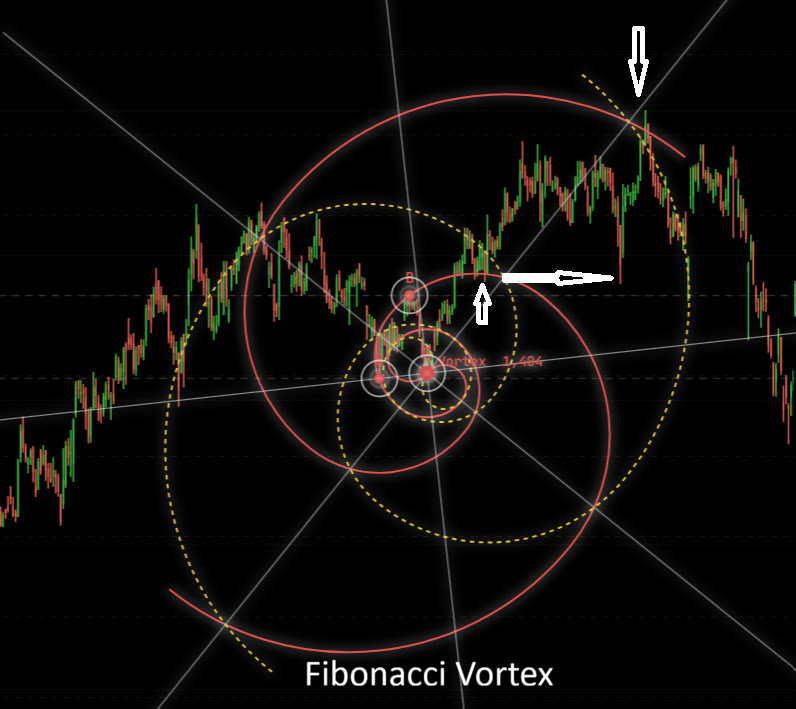
The three forms
- Vortex
- Quarter-circle arcs chained into a spiral that grows as it winds, with a solid arm and its mirrored, dotted twin.
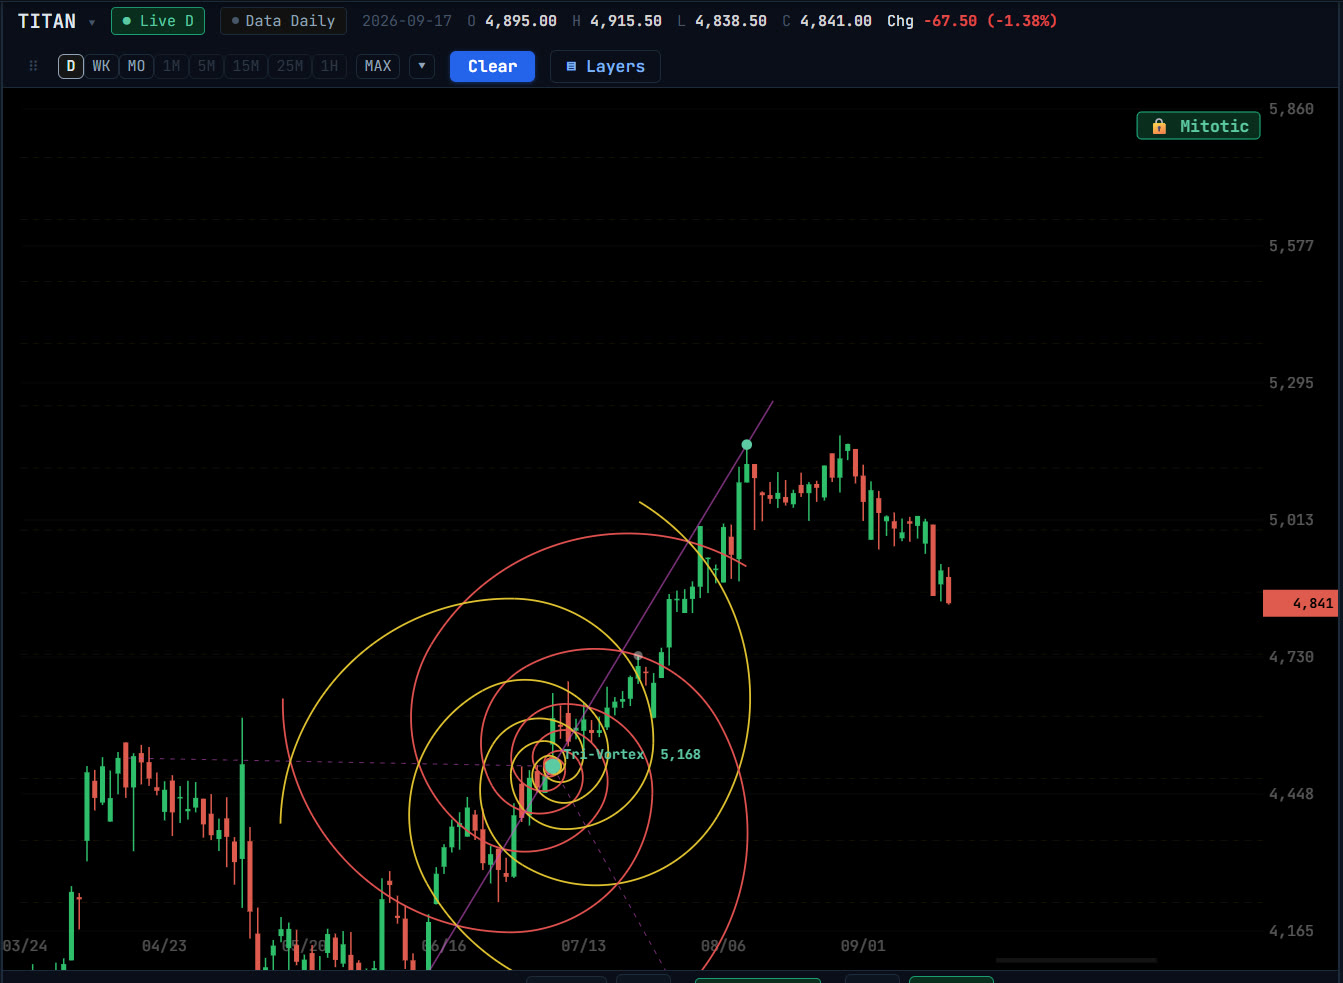
- Tri-Vortex
- Three spiral arm pairs at 0°, 120° and 240°. Arc radii follow 1, 2, 3, 5, 8, 13, 21, 34, 55.
- Penta-Vortex
- Five spiral arm pairs at 0°, 72°, 144°, 216° and 288°.
Placing it
- 1Choose Vortex, Tri-Vortex or Penta-Vortex from Overlays. The hint on the chart names each click as you go.
- 2Click the points that set the spiral’s rotation and scale, typically significant swings the spiral should pass through.
- 3Click the centre the spiral turns about. The arms are drawn at once and stay fixed to those price-time points.
Why the scale matters
A spiral mixes price and time in every curve, so its shape is only meaningful if one unit of price and one bar keep a fixed relationship. Geometriya draws it on Mitotic Scaling, so the spiral keeps its proportions at any zoom.
Questions
What is the difference between Tri-Vortex and Penta-Vortex?
Both use the same Fibonacci spiral. Tri-Vortex rotates it into three arms 120° apart; Penta-Vortex into five arms 72° apart.
Related tools
Geometry
Geometric Constructions →
Sacred geometry on price charts: equilateral triangles from swing legs, squares and cubes, a pentagon with its level and dates, and Metatron’s Cube.
Fibonacci
Fibonacci Tools →
Fibonacci retracements, trend-based extensions, √-price extensions, time zones and time extensions, with automatic swing placement and a level scanner.
Gann · Squares
Gann Box (Gann Square) →
Place a Gann Box from a swing low or high in one click: 5×5 or 8×8 squares, arcs, the 1×1 balance line, an angle fan and time subdivisions.