
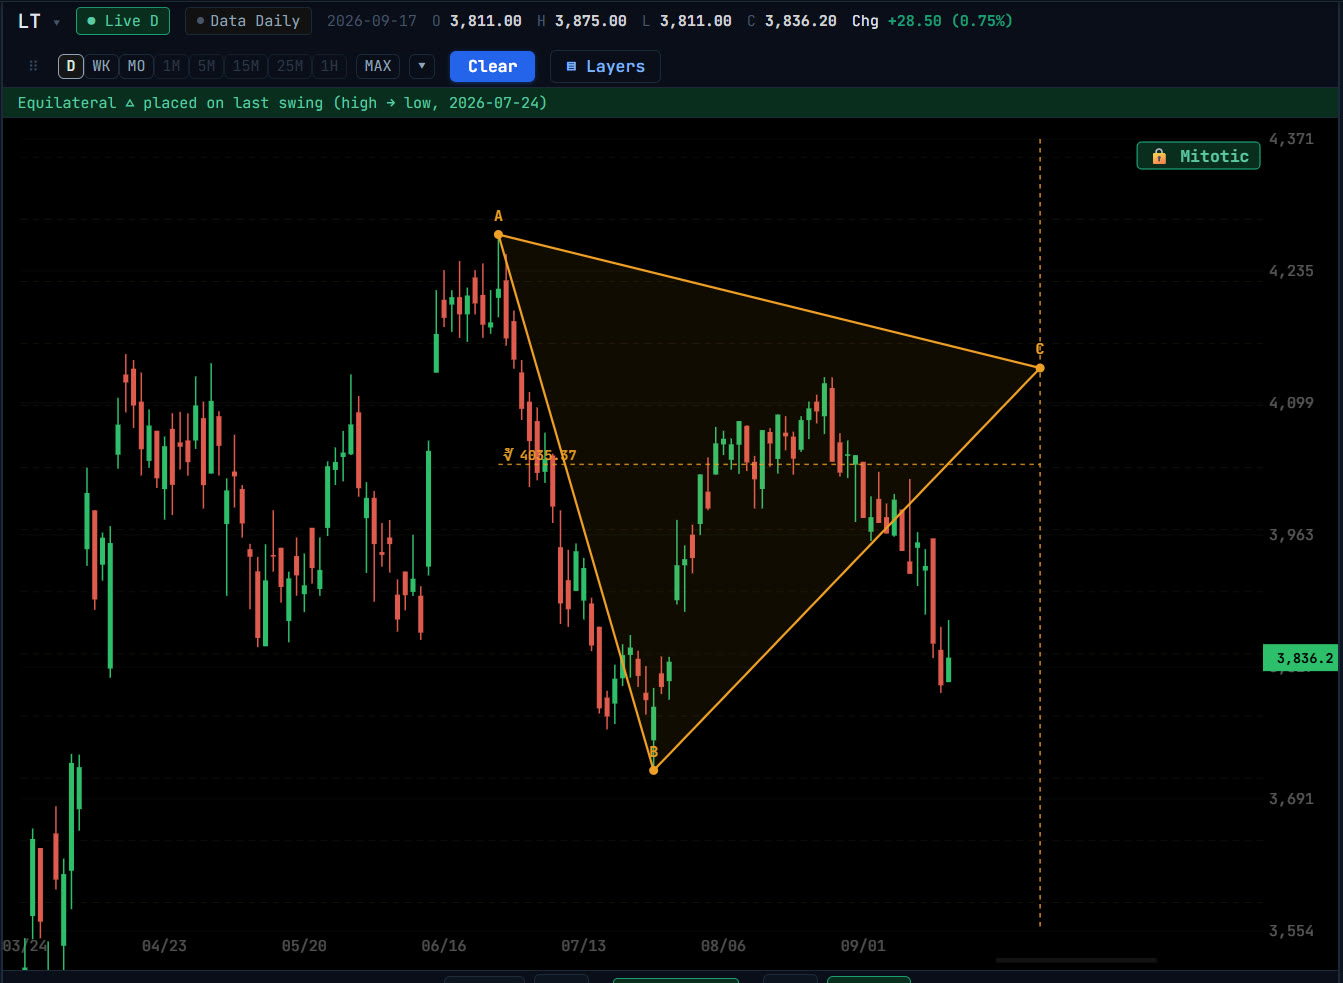
The constructions
- Equilateral Triangle
- Built on a swing leg you click, so the leg’s own length sets the triangle that projects forward from it. Its third vertex, C, lands ahead of price, and a dashed vertical marks that date. ⚡ places it on the latest swing.
- Square / Cube
- A square and its cube division from two points, for reading price and time against a fixed box rather than an angle.
- Pentagon
- A regular pentagon from one side you click. It gives a support and resistance level (the geometric mean of its five vertex prices) and forward dates at vertices C, D and E.
- Metatron’s Cube
- The thirteen circle centres of the Fruit of Life with every pair joined, and the Platonic figures drawn inside it on the flower’s own points. Switch figures from the label on the chart.
Why geometry needs a fixed scale
A triangle is only equilateral, and a square only square, if a unit of price and a bar keep the same relationship. On an ordinary chart the shapes distort as you zoom. Mitotic Scaling fixes that relationship, so the constructions hold their shape.
Questions
What does the pentagon’s green line mean?
It is the fifth root of the product of the five vertex prices, their geometric mean, read as a support or resistance level.
Can I scan for stocks at a triangle?
Yes. Triangles are among Geometriya’s scanners.
Related tools
Geometry
Vortex →
Fibonacci spiral constructions on price charts: Vortex, Tri-Vortex at 120° and Penta-Vortex at 72°, placed from a centre, a rotation point and a scale point.
Gann · Squares
Gann Box (Gann Square) →
Place a Gann Box from a swing low or high in one click: 5×5 or 8×8 squares, arcs, the 1×1 balance line, an angle fan and time subdivisions.
Time
Time Projection Tools →
Project future turning dates: time series, time circles, calendar-to-trading-day counts, digit-reversed bar counts, ratio time lines and mirror foldback.