
The tools
- Time Series
- Equally spaced vertical lines running forward from a pivot: the same interval repeated. Defaults to 8 lines, 45 bars apart.
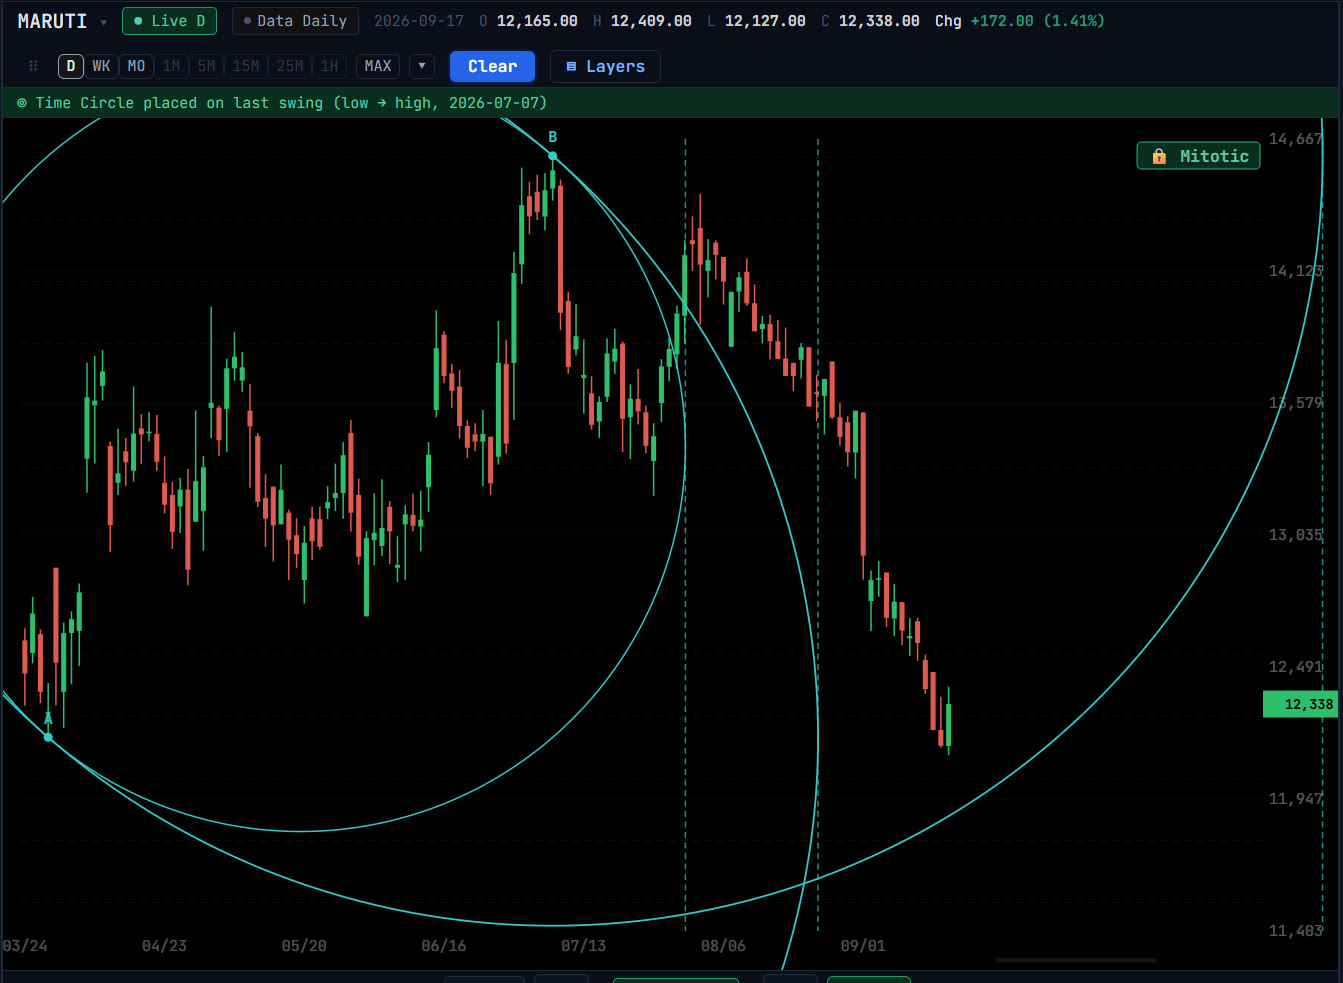
- Time Circle
- Projects three time targets forward from a swing, drawn as a circle in price and time. Its scanner reports how many trading days each stock is from its own three dates.
- Calendar → Trading
- Takes the calendar-day count between two swings and re-lays it as trading days, so the projected line lands beyond the swing. Each later swing you click fires its own line.
- Time Calculator
- Reverses a swing’s bar count digit by digit and projects it forward: a 41-bar leg projects 14 bars on.
- Ratio Calculator
- Fires a family of ratio lines from a swing, as price levels or, in Time mode, as forward time lines.
- Mirror Foldback
- Folds the swing structure of the left side of a move across its centre, turning the past shape of the move into forward time lines.
Using time and price together
A projected date is not a forecast of direction. What it marks is when to pay attention: a date that lines up with a price level from another tool, such as a Gann square boundary or a 45° angle, is a stronger reading than either alone.
Several of these tools support ⚡ to anchor on the latest confirmed swing and ◀ to step back through earlier ones.
Questions
Why convert calendar days to trading days?
Markets count time in sessions, but many cycles are measured in calendar days. Re-laying one as the other shows where a calendar cycle lands on a trading chart, beyond the swing it was measured from.
Does a time line predict whether price goes up or down?
No. Time tools mark when a change is more likely, not its direction. Direction comes from price structure and the other tools.
Related tools
Time
Mirror Image Foldback →
Mirror Image Foldback folds the swings inside a move across its turning point, turning the past shape of the move into forward time lines and angles.
Time
Calendar to Trading Days →
Cal→Trade counts the calendar days between swings and re-lays them as trading days, projecting where a calendar cycle lands beyond the swing.
Time
Ratio Calculator →
Fire a family of ratio lines from a swing, as price levels from an extreme or as forward time lines from a leg, placed by hand or on the latest swing.