
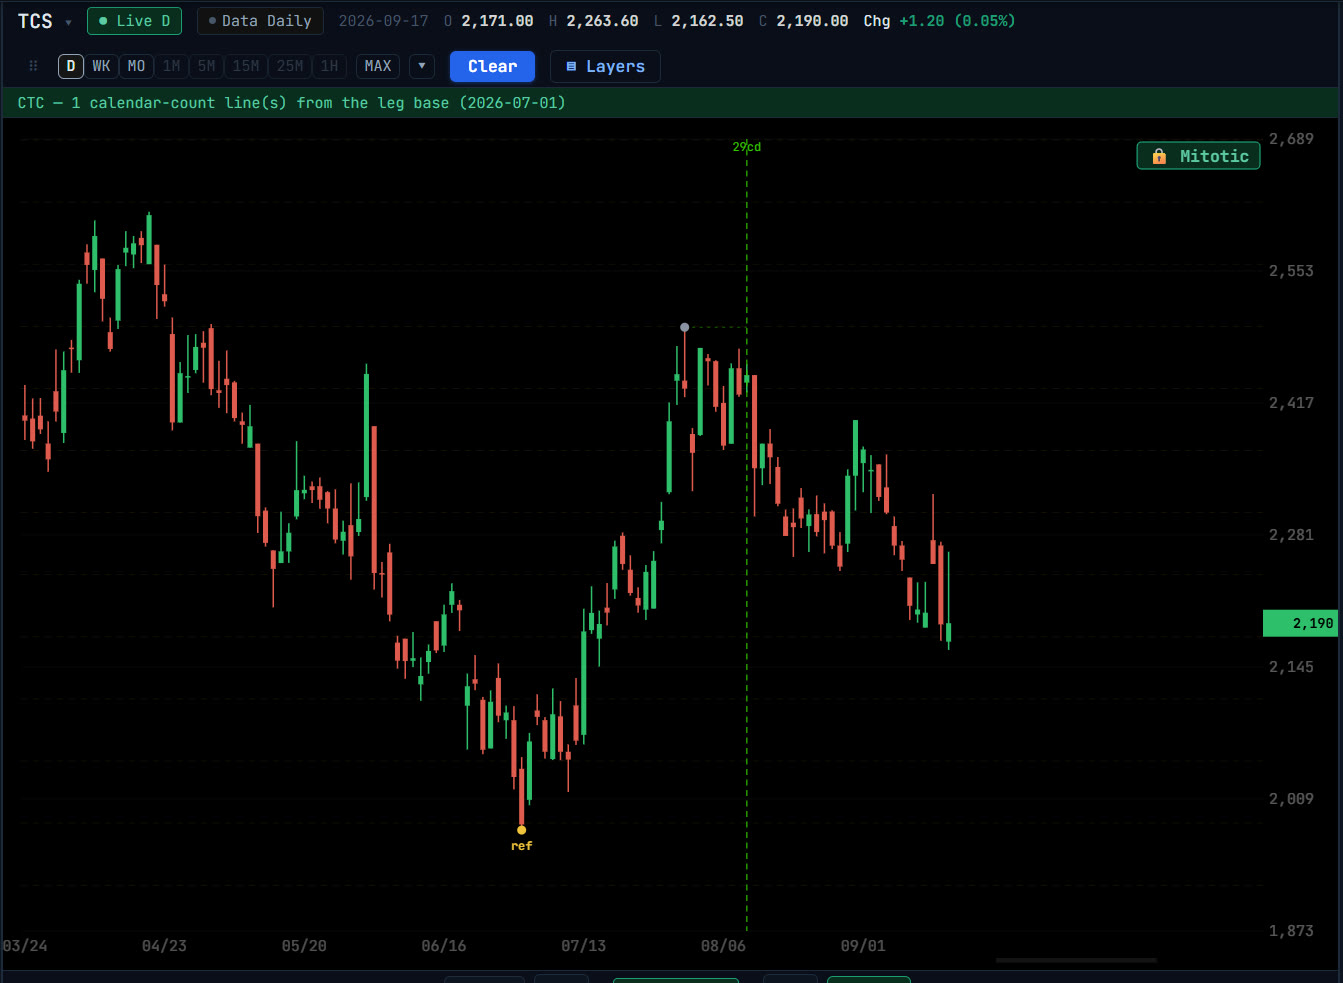
Why the conversion matters
Between two swings a month apart there may be 30 calendar days but only about 21 trading sessions. Counting the calendar days again as sessions pushes the projection forward past weekends and holidays, which is where calendar-based cycles tend to show up on a trading chart.
Placing it
- 1Open Cal→Trade from the Time group in Overlays.
- 2Click a reference swing point, then each later swing point you want measured. Every one fires its own projected line.
- 3Or press ⚡ to place it automatically on recent swings, and ◀ to step back to earlier ones.
Reading it
Each line is a date to watch, not a direction. Several lines from different swings clustering near one date, or a line meeting a price level from another tool, is the reading worth attention.
Questions
Does it account for exchange holidays?
The projection counts the bars on the chart itself, and the chart only has bars for sessions the exchange was open, so holidays are skipped by construction.
Related tools
Time
Time Projection Tools →
Project future turning dates: time series, time circles, calendar-to-trading-day counts, digit-reversed bar counts, ratio time lines and mirror foldback.
Time
Mirror Image Foldback →
Mirror Image Foldback folds the swings inside a move across its turning point, turning the past shape of the move into forward time lines and angles.
Time
Ratio Calculator →
Fire a family of ratio lines from a swing, as price levels from an extreme or as forward time lines from a leg, placed by hand or on the latest swing.