
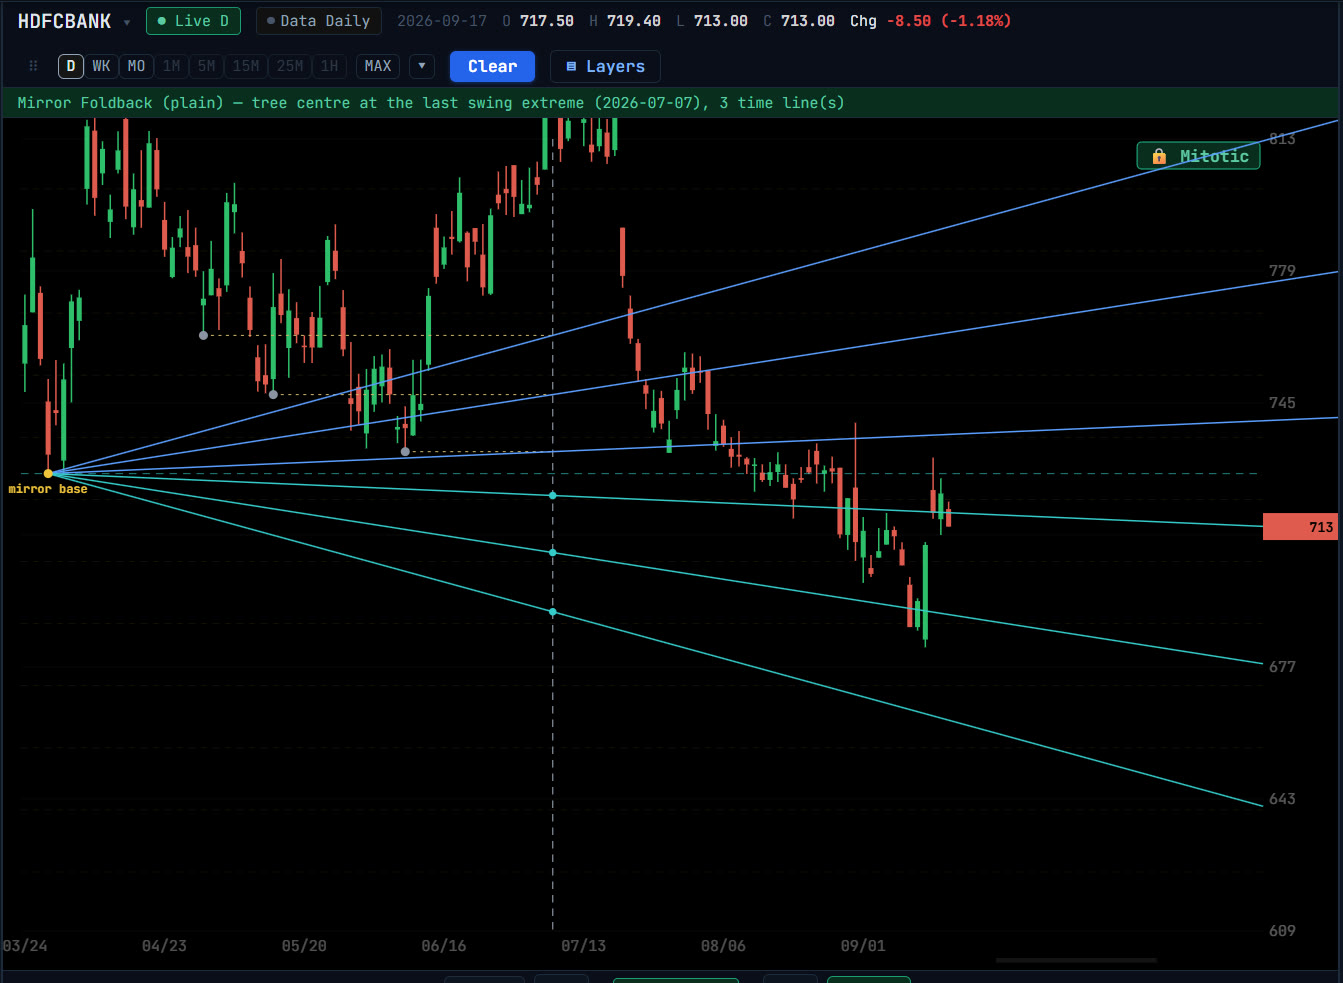
What it does
Pick a leg and its turning point, the tree centre. Each smaller swing inside the leg, a node, is folded across the centre and projected forward as a vertical time line. The dates are the past structure of the move, mirrored.
Three methods
- Plain angles
- The water-image foldback: angles fired through each folded node and through its reflection, which also act as support and resistance.
- Node circles
- Each node’s price distance from the centre becomes a circle, and a time line rises where it crosses. Price is folded into time using the Mitotic scale.
- Octave
- The leg’s height is cut into eight equal parts, and angles through each division land at octave multiples of the leg’s length in bars.
Placing it
- 1Open Mirror Foldback from the Geometric group in Overlays and choose a method.
- 2Click the leg and then its swing nodes; each node’s lines are drawn as you click. Press Esc or right-click to finish.
- 3Or press ⚡ to put the centre at the last confirmed swing and pick the nodes from the finer swings inside the leg.
Questions
Why would the future mirror the past?
It is a working assumption from Gann-style analysis, not a law: the time a market spent building one side of a move is a reasonable first guess at the time it spends on the other. The lines mark when to pay attention, not what price will do.
Can I scan for it?
Yes. Mirror Foldback has its own scanner in the Overlays panel.
Related tools
Time
Time Projection Tools →
Project future turning dates: time series, time circles, calendar-to-trading-day counts, digit-reversed bar counts, ratio time lines and mirror foldback.
Time
Calendar to Trading Days →
Cal→Trade counts the calendar days between swings and re-lays them as trading days, projecting where a calendar cycle lands beyond the swing.
Time
Ratio Calculator →
Fire a family of ratio lines from a swing, as price levels from an extreme or as forward time lines from a leg, placed by hand or on the latest swing.