
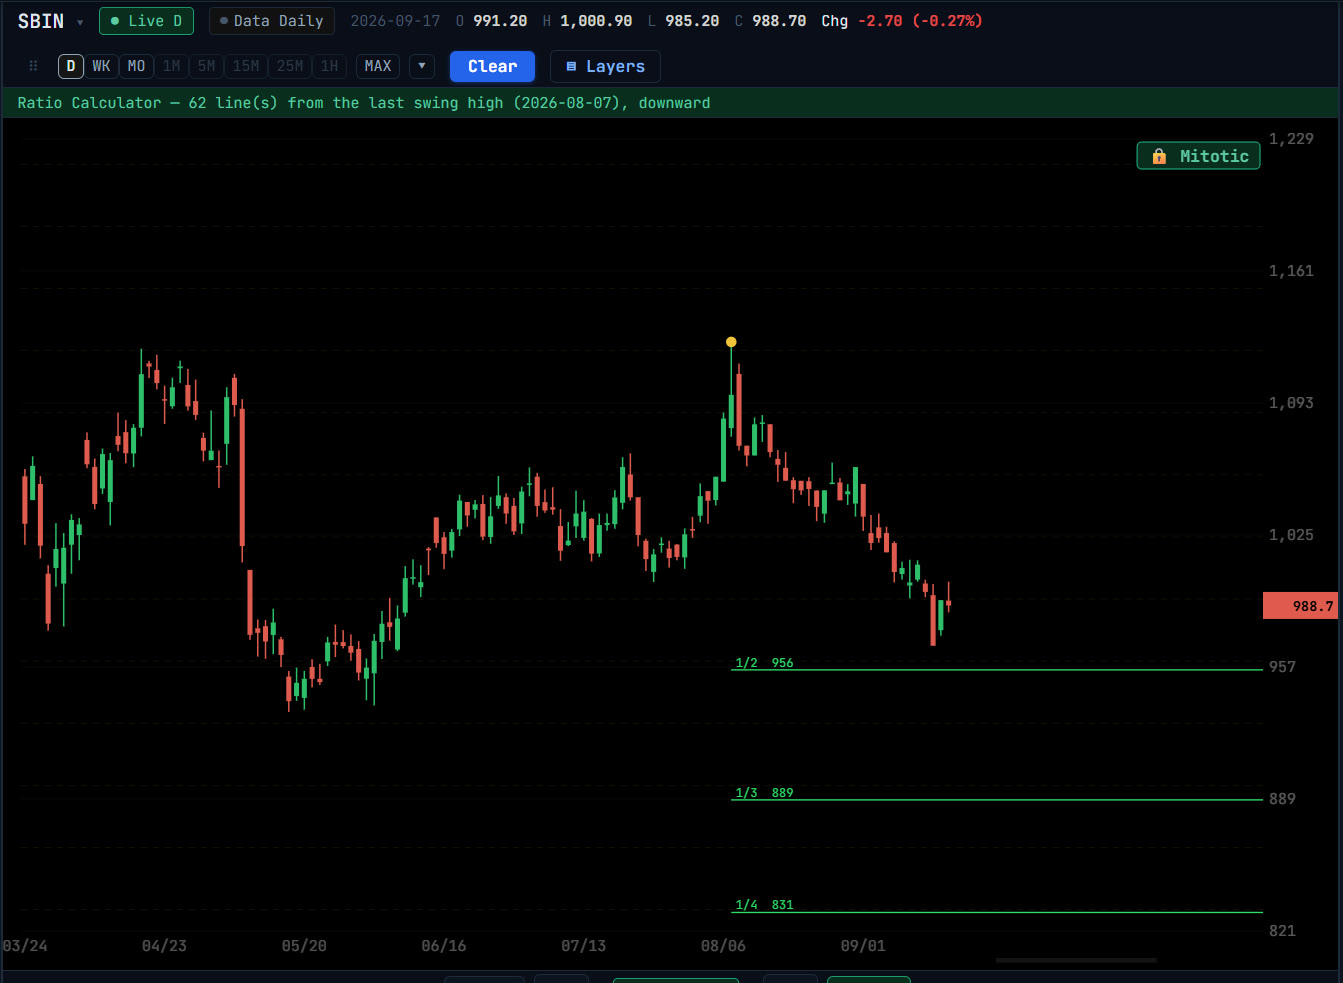
Two modes
- Price mode
- One click on a swing high or low. The chosen ratios are drawn as price levels from that extreme: downward from a high, upward from a low.
- Time mode
- Two clicks, the start and end of a swing. The swing’s length in bars is multiplied by each ratio and drawn as forward time lines.
Placing it
- 1Open Ratio Calculator from the Time group in Overlays. The ratio picker opens first; choose the ratios and the mode.
- 2Click the extreme (Price mode) or the swing’s start and end (Time mode).
- 3Or press ⚡ to anchor on the last confirmed extreme, and ◀ to step back to earlier swings.
Reading it
A ratio line is a place to watch, and a price level and a time line landing together are stronger than either alone. Combine Price and Time mode on the same swing to find where the two meet.
Questions
How is this different from the Fibonacci tools?
The Fibonacci tools use fixed Fibonacci ratios. The Ratio Calculator lets you choose the ratio family, and projects it in price or in time from the same kind of swing.
Related tools
Fibonacci
Fibonacci Tools →
Fibonacci retracements, trend-based extensions, √-price extensions, time zones and time extensions, with automatic swing placement and a level scanner.
Time
Mirror Image Foldback →
Mirror Image Foldback folds the swings inside a move across its turning point, turning the past shape of the move into forward time lines and angles.
Time
Calendar to Trading Days →
Cal→Trade counts the calendar days between swings and re-lays them as trading days, projecting where a calendar cycle lands beyond the swing.