
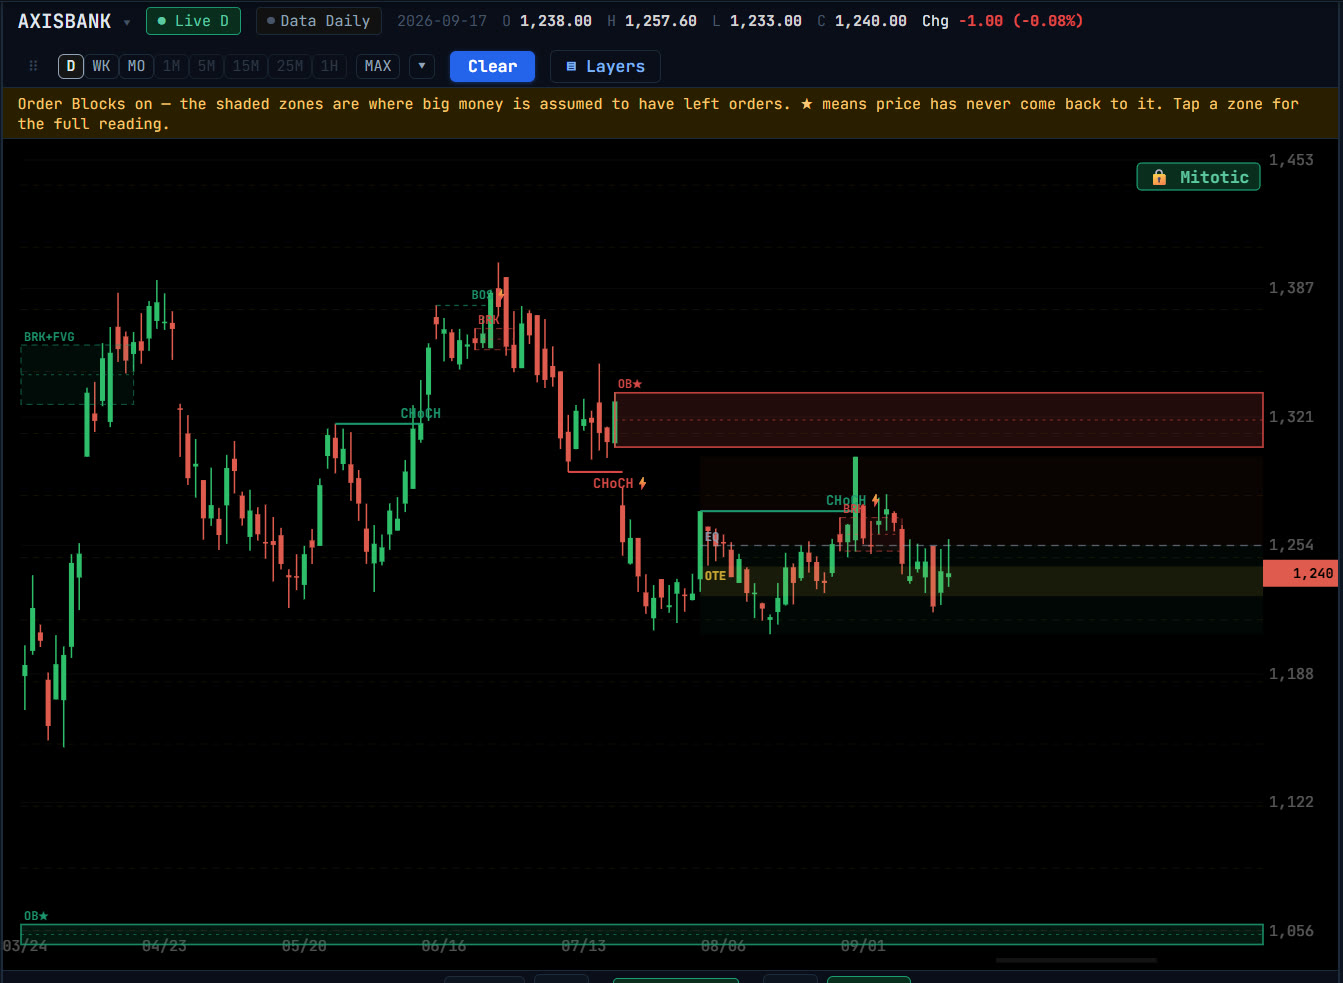
Market structure: BOS and CHoCH
A BOS (break of structure) is a close beyond the last swing in the same direction as the trend, a sign of continuation. A CHoCH (change of character) is the first close beyond a swing the other way, the earliest warning of a reversal. Breaks are judged on the close, never a wick.
The dealing range behind them is shaded into premium (red) and discount (green) either side of its 50% equilibrium, with the 0.618 to 0.786 OTE band in amber.
Order blocks and breakers
An order block is the last opposing candle before a move that broke structure. Its 50% midline is drawn, and ★ marks a block price has never returned to. A block that price came back to and closed cleanly through has failed; it flips polarity and is drawn hatched as a Breaker. "+FVG" marks a block overlapped by a fair value gap from the same move, the confluence ICT traders wait for.
Fair value gaps and price gaps
- Fair Value Gap (FVG)
- A three-candle imbalance: a range the middle candle moved through so fast it left untraded space either side. Its 50% midline is drawn; a wick back through it mitigates the gap. "Show all: FVG" surveys every gap on the chart.
- Price Gap
- The untraded space between one session’s close and the next session’s open. ⚡ marks the most recent unfilled gap with its type and size.
Liquidity sweeps and RSI divergence
- Liquidity sweeps
- Stops rest beyond equal highs, equal lows and swing points. A sweep is a bar that traded through such a level and closed back inside: a raid rather than a breakout. A sweep below lows (SSL) is bullish; above highs (BSL), bearish.
- RSI divergence
- A lower price low on a higher RSI low (green), or a higher price high on a lower RSI high (red). It is a warning rather than a trigger, and reads best at a level another method already marks.
Questions
What is the difference between a BOS and a CHoCH?
A BOS breaks structure in the direction of the existing trend. A CHoCH is the first break against it, which is why it is read as an early sign of reversal.
What is a Breaker block?
An order block that price returned to and closed straight through. It has failed as support or resistance and flipped polarity, which many ICT traders treat as the stronger level.
Do I have to draw these myself?
No. Each is a toggle; Geometriya detects them from the chart’s own swings, and the settings let you tune swing length and thresholds.