
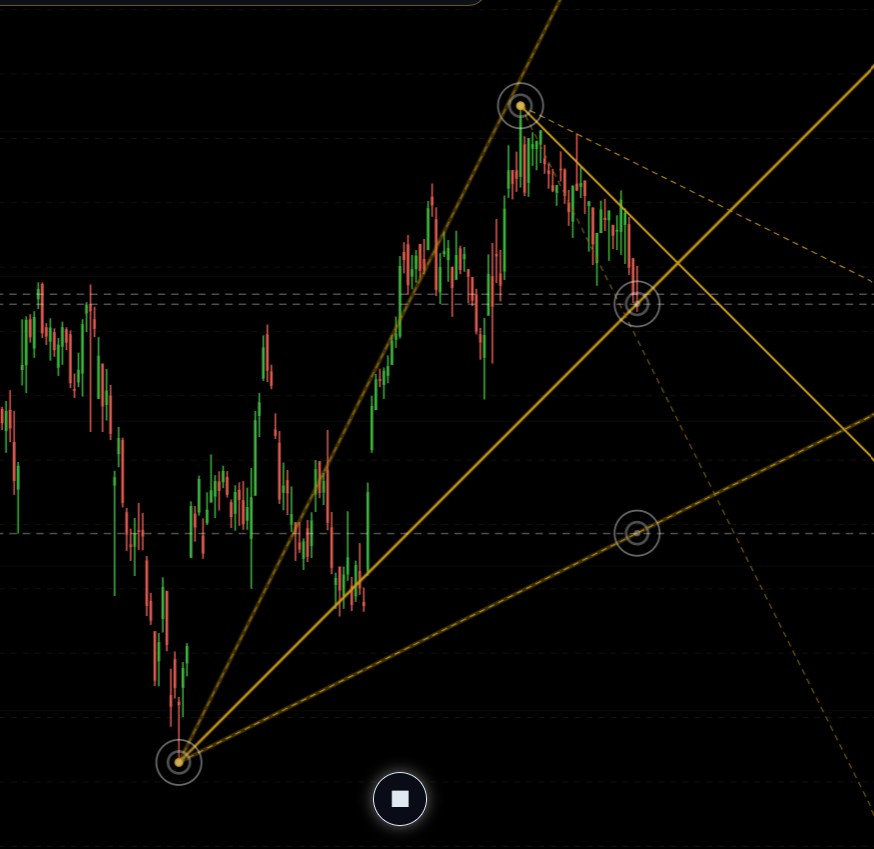
What the 45° angle is
The 45° angle, or 1×1, is the diagonal of a square: one unit of price for one unit of time. W. D. Gann treated it as the balance point between price and time. A market rising faster than the line is strong for the time it has taken; one falling below it has lost that balance.
It is drawn upward from an important low and downward from an important high. Price tends to return to the line later, and what it does there is the information: it can bounce off it, pause along it, or break through it, and each says something different about the strength of the move. Angles drawn on higher timeframes carry more weight than the same angle on a lower one.
Why a 45° angle needs the right scale
On an ordinary charting platform the slope of a drawn line depends on how far you have zoomed. Stretch the chart and a 45° line becomes 30° or 60°, so the angle stops meaning anything.
Geometriya draws on Mitotic Scaling, its own fixed price-per-bar scale. Lock it once and a 45° angle stays a true 45° through every pan, zoom and timeframe, which is what makes Gann angles usable at all.
What Dream-45 adds
Plotting an angle is the easy part. The hard part is remembering to come back. Traders place angles on dozens of stocks and then find, weeks later, that price already came back to the line and moved on.
Dream-45 keeps every angle you plant and checks all of them for you. Each angle carries a stamp (the symbol, timeframe, direction and its own number), so when the scanner reports a stock you know exactly which angle it is sitting on.
How to use it in Geometriya
- 1Open a chart and click ↑45 in the toolbar, then click an important swing low. Use ↓45 and click a swing high for a falling angle.
- 2Repeat on any stocks and timeframes you follow. Every angle is saved with its stamp.
- 3Open the scanner with 🔍 D45. Choose an index preset or one of your watchlists, and set a % filter to keep only stocks close to their angle.
- 4Sort by % Diff to put the stocks nearest their 45° at the top, then click a row to open that chart.
Reading the scanner
- Plot Price
- The price at the point where you planted the angle.
- Today’s H/L
- Today’s low for an up angle, today’s high for a down angle.
- Today’s 45°
- Where the 45° line sits on today’s bar.
- +1D 45°
- Where it will sit on the next bar, for planning a day ahead.
- Diff and % Diff
- How far today’s low or high is from the line, in price and in percent.
- % Diff 2×1 and % Diff 1×2
- The same distance to the steeper and shallower angles from the same point. They are calculated even though only the 45° is drawn, to keep the chart clean.
- Days
- Bars since the angle was planted.
Let Geometriya find the swing
Auto ∠ detects the latest swing low by itself and draws the angle fan without a click, redrawing as new candles form. Auto Scan runs that same detection across a watchlist or index and ranks each stock by how close it sits to its own angle.
Questions
Is Dream-45 the same as a Gann fan?
It starts from the same 1×1 line a Gann fan is built around. The difference is tracking: Dream-45 saves every angle you plant and scans all of them together, so you find the stocks that are on their angle today instead of opening charts one by one.
Which timeframe works best?
Angles can be planted on daily, weekly and monthly charts. In Gann’s method a higher timeframe outranks a lower one, so an angle from a monthly swing low is the more significant line.
Does Dream-45 place trades for me?
No. Geometriya is an analysis and paper-trading tool. The scanner shows where price stands against your angles; you can practise acting on that with simulated trades, but no real orders are placed.
Which markets can I scan?
NSE stocks, including the Nifty 500 universe, plus index presets for the JSE and US markets.
Can I try it free?
Yes. You get 30 days of Full Access free, then the free Starter plan keeps every geometry tool, Dream-45 included, on 20 large-cap stocks plus NIFTY 50 and BANKNIFTY.