
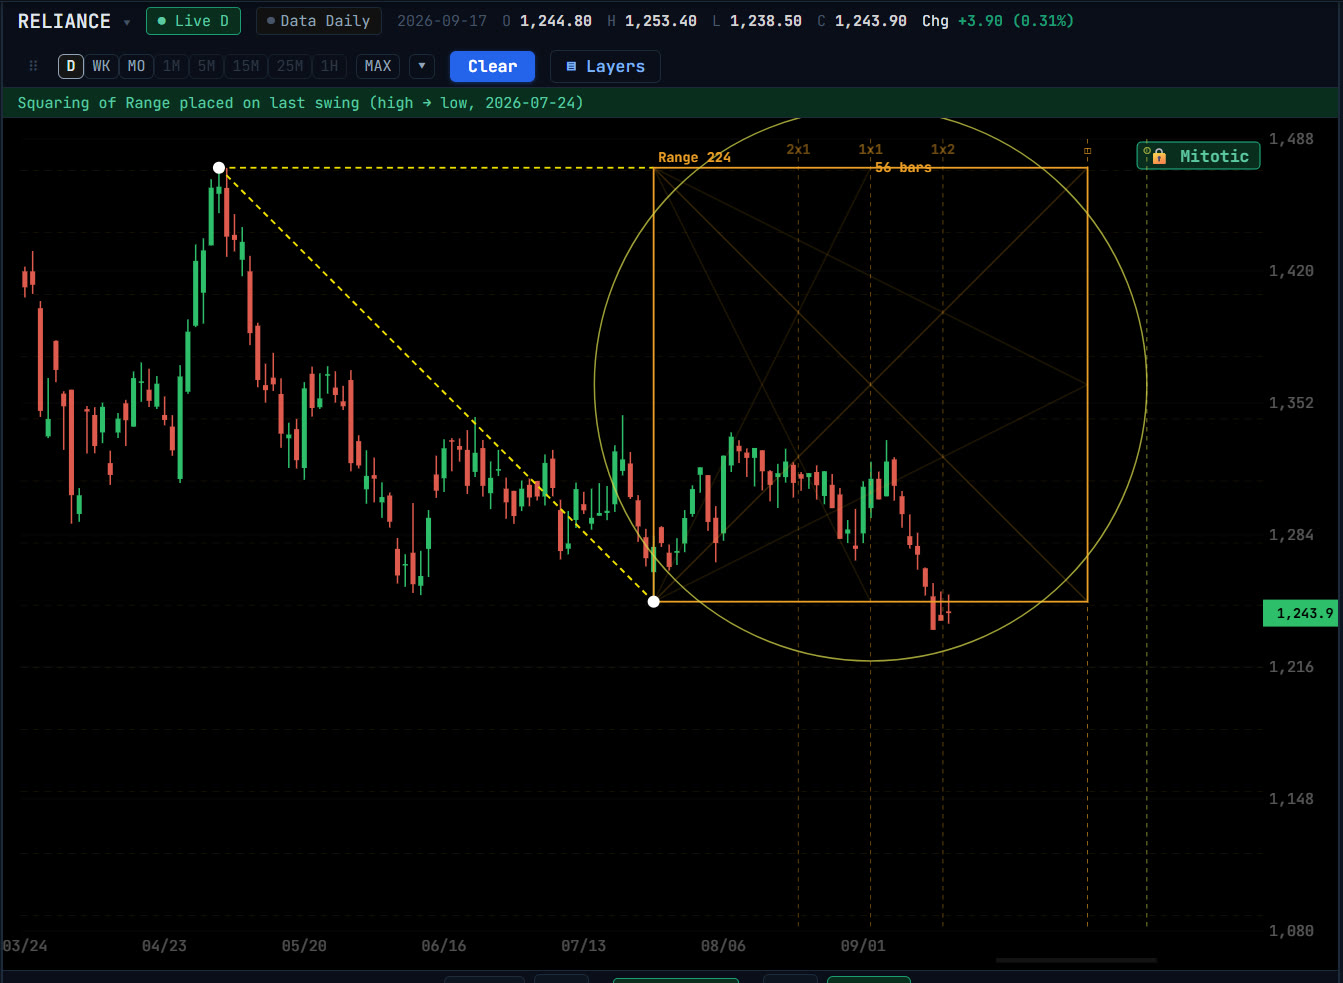
Squaring a low, a high or a range
- Squaring of Low
- The low’s own price becomes the side of a square: as many bars wide as it is price units tall, at the current Mitotic scale. Click the low, then walk the grid with ▲ ▶ ▼, each click placing the next square edge to edge.
- Squaring of High
- The same construction anchored on a high, walked out in time from that pivot.
- Squaring of Range
- Squares the height of a swing (high minus low) instead of a single price, so the square is sized by how far the move travelled. It projects forward from the second point you click, the end of the move.
How to read the squares
Each square boundary is a checkpoint in both price and time. The dashed verticals mark the bar each boundary lands on, so the date can be read straight off the chart, and price arriving at a boundary on or near that date is the reading squaring is looking for.
Converting price into time
- Price → Time
- Converts a price into a forward bar count using the Mitotic scale and drops time lines there, plus the same count at 0.618, 1, 1.618 and 2.618.
- Price Lookback
- The backward twin: takes the current price as a bar count and marks the bar that many bars in the past, used to confirm a change in trend.
Questions
What does squaring price and time mean?
It is W. D. Gann’s idea that price and time are interchangeable units. When a market has moved as many units of time as of price from a pivot, the two are "squared", and a change in trend becomes more likely.
Why does squaring need Mitotic Scaling?
To make one unit of price equal one bar, the chart needs a fixed price-per-bar scale. Mitotic Scaling provides it, so the squares stay true squares at any zoom.
Can I scan for stocks at a squaring level?
Yes. Squaring of Range is one of Geometriya’s scanners.
Related tools
Gann · Squares
Gann Box (Gann Square) →
Place a Gann Box from a swing low or high in one click: 5×5 or 8×8 squares, arcs, the 1×1 balance line, an angle fan and time subdivisions.
Gann · Angles
Gann Angles →
Gann angle tools beyond the 45°: convert a price into an angle, fan a swing’s own angle, bounce 45° lines off zero, and the Secret Angle’s forward dates.
Time
Time Projection Tools →
Project future turning dates: time series, time circles, calendar-to-trading-day counts, digit-reversed bar counts, ratio time lines and mirror foldback.