
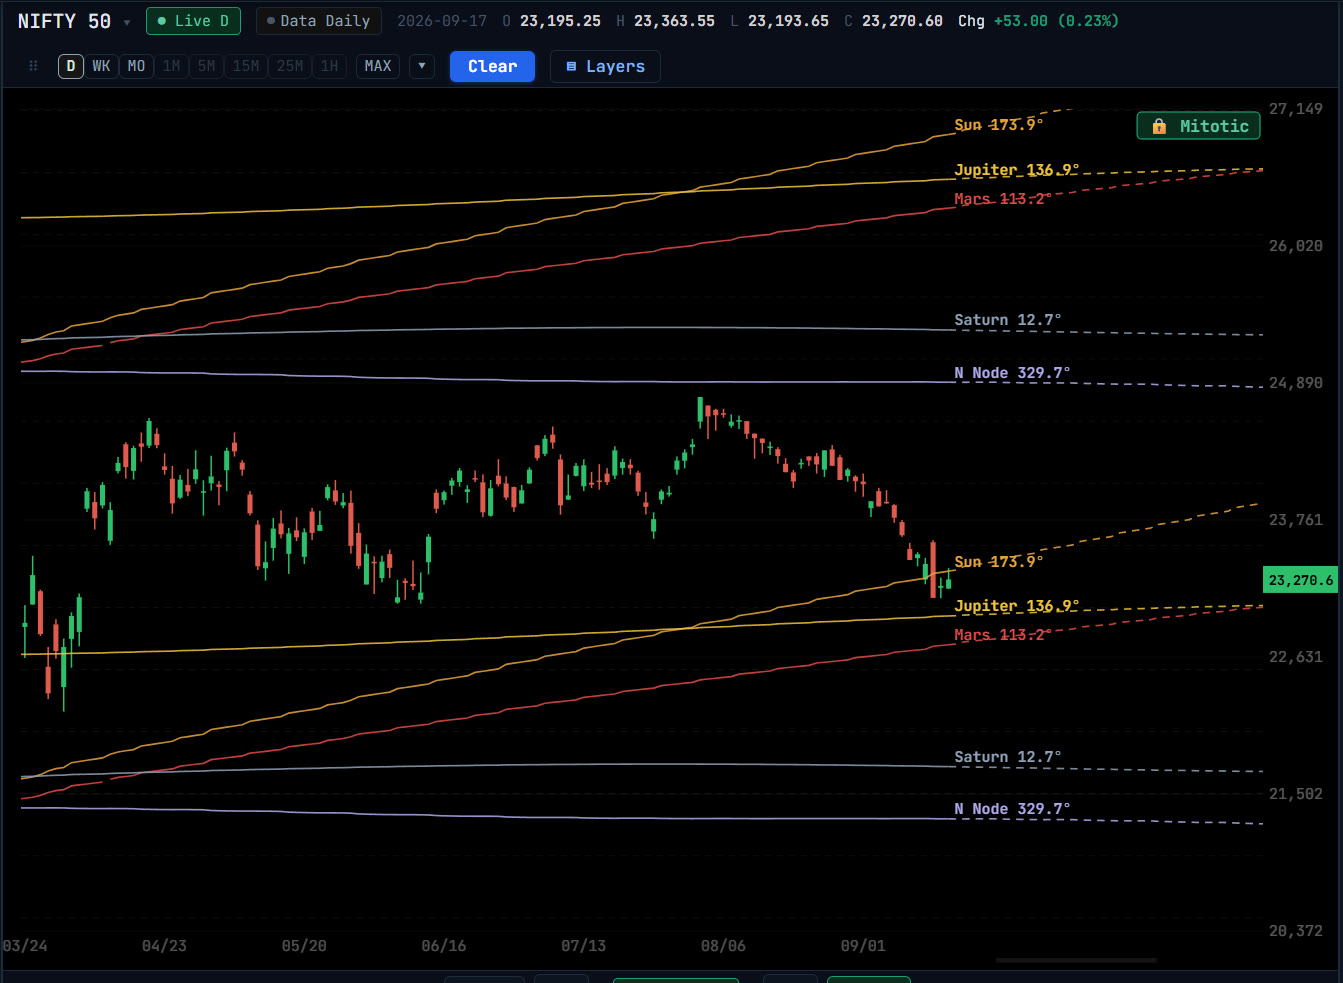
How the lines are drawn
A planet’s longitude is its position round the zodiac, from 0° to 360°. Geometriya draws it as a price level and repeats the band every 360 up and down the chart, so a ₹300 stock and the Nifty both get the same degrees marked. A line that flattens is a planet turning retrograde.
Each line continues past the last candle as a dashed projection. A planet’s position on a future date is arithmetic, not a forecast, so a level can be read weeks before price reaches it.
Settings
- Bodies
- Choose which bodies are drawn: the Sun, the planets and the lunar North Node.
- Degree mapping
- One degree as one price unit, the original tool’s mapping, or as one Mitotic step.
- Mirror
- Adds the 360° minus longitude reading.
- Ruling planets
- Names the bodies said to rule the stock, read from the sector list of its own exchange (NSE, US or JSE), and makes their lines pulse.
Reading them
The lines are levels, not signals. Watch for a swing high or low forming where price meets a slow body’s line: Jupiter, Saturn and the outer planets hold a level for months, while the Sun sweeps a whole band in a year.
The 🔍 scanner runs the same reading across a stock list and lists which stocks are trading on one of their own ruling bodies’ lines today.
Questions
How can a planet’s position be a price level?
Gann and later financial astrologers mapped degrees of longitude directly onto price. Geometriya draws that mapping and repeats it every 360 so it covers any price range.
What are ruling planets?
In financial astrology, sectors are associated with particular planets. Geometriya reads each stock’s sector from its exchange’s list and highlights those planets’ lines.
Is this a prediction?
No. Planet positions are exact calculations, but the lines are levels to watch, not buy or sell signals.