
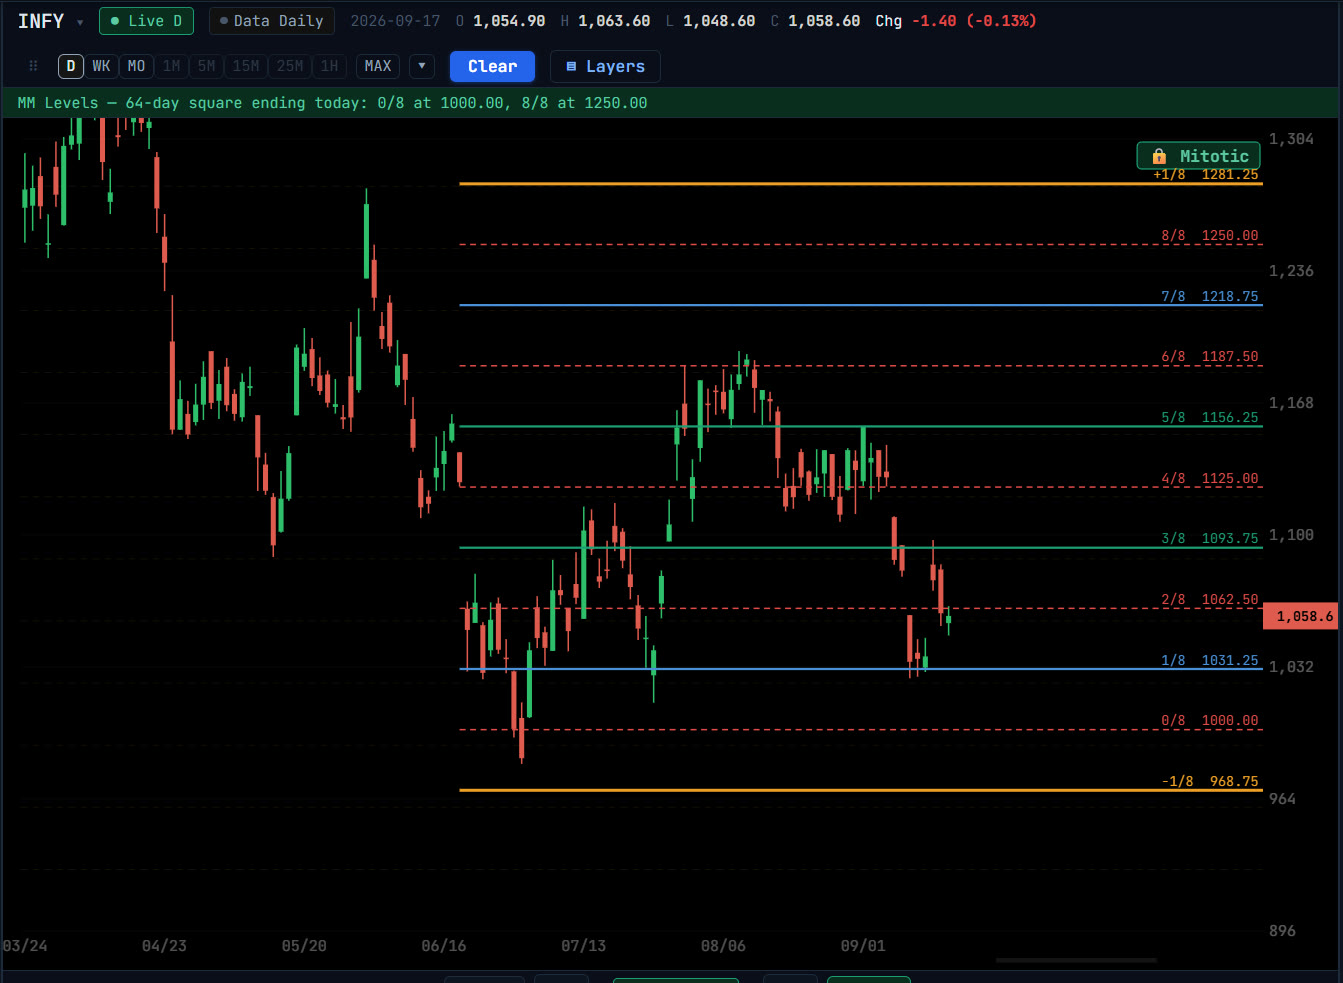
Using MM Levels
- 1Open MM Levels from Overlays and choose a Square Width.
- 2Click the bar the square should start on, or press ⚡ to end the square on the latest bar and get today’s levels.
- 3Press ◀ to step back one full Square Width at a time and see how the grid stood earlier.
Reading the grid
Unlike a single support or resistance line, Murrey Math divides the whole range into a grid of levels. It is read like the Gann octaves it came from: the outer lines are the extremes of the range and the middle line its balance point.
Questions
What is the Square Width?
The window of bars the levels are computed over. A wider square gives levels for a longer view of the range.
How are Murrey Math lines related to Gann?
Murrey built his system as a simplification of W. D. Gann’s octave divisions of price, which is why the levels fall at eighths of a range.
Related tools
Gann · Squaring
Squaring Price and Time →
Square a low, a high or a swing’s range against time, convert price into a forward bar count, and look back one price’s worth of bars. Gann squaring tools.
Fibonacci
Fibonacci Tools →
Fibonacci retracements, trend-based extensions, √-price extensions, time zones and time extensions, with automatic swing placement and a level scanner.
Zones
Supply & Demand Zones →
Mark supply and demand zones by hand or detect the latest unbroken zone automatically from base-and-impulse structure, with adjustable detection settings.