
What it checks
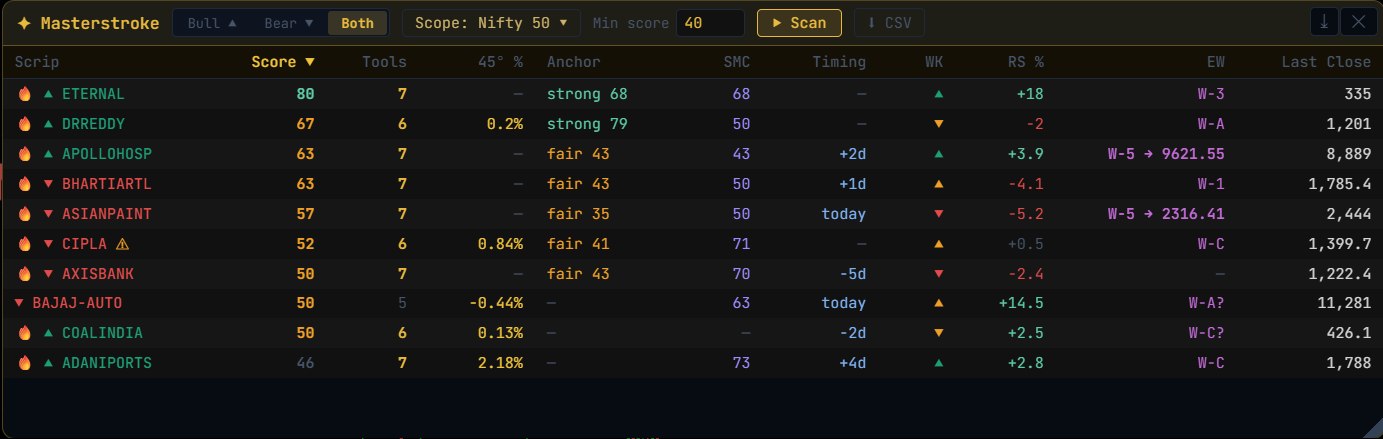
Each method reads the chart on its own and casts a vote for a direction. Nothing has to be drawn first — every read is computed from the scrip’s own chart.
- 1Is price sitting on its own automatic 45° angle, and is the anchor behind that angle a strong one?
- 2Have the smart-money reads lined up — a structure shift, a liquidity sweep and an order block?
- 3Is price near a Gann arc, and is a squaring or time-circle checkpoint due?
- 4Did a reversal candle just print, or is there an RSI divergence — a new price extreme on fading momentum?
- 5Is price holding the average price paid since the anchor (anchored VWAP)?
- 6Does the weekly structure agree, and where does the Elliott count say price is in its sequence?
- 7Is a Wolfe Wave forming, and is the scrip leading or lagging its index over recent sessions?
Reading the results
Votes in the same direction add up; votes pointing the other way count against them. A scrip with five clean bullish reads therefore ranks above one with five bullish and three bearish. The Tools column shows how many independent methods agreed, and tapping a row shows every vote — including the ones pulling the other way — so you can see why a scrip ranks where it does.
Click any row to open that chart. Like every scanner in Geometriya it describes what the geometry shows; it does not tell you to buy or sell, and practice happens in Paper Trading.
The ✦ chart meter
The same read also appears as a slim ✦ strip on your open daily chart: the score, the direction and the tools that contributed, updated as you switch stocks. Tap it for the full breakdown. Turn it on or off by right-clicking ✦ Master in the toolbar, or ask Geo-Tutor to “open masterstroke”.
Using Masterstroke
- 1Click ✦ Master in the toolbar (or ask Geo-Tutor for the “masterstroke scanner”).
- 2Choose the scope — the whole market, an index such as the Nifty 50, or one of your watchlists — and press Scan.
- 3Sort by score or by the number of agreeing tools, tap a row to see its votes, and click it to open the chart.
Questions
Do I need to draw anything before running Masterstroke?
No. Every method it uses is computed automatically from each scrip’s own chart, so it works on scrips you have never opened.
Why does the chart meter only show on daily charts?
Every method Masterstroke combines reads daily bars. Showing a daily score on an intraday chart would describe a different chart from the one on screen.
Does a high score mean the stock will go up?
No. It means many independent geometry methods currently read the chart the same way. It is a way to find charts worth studying, not a forecast.