
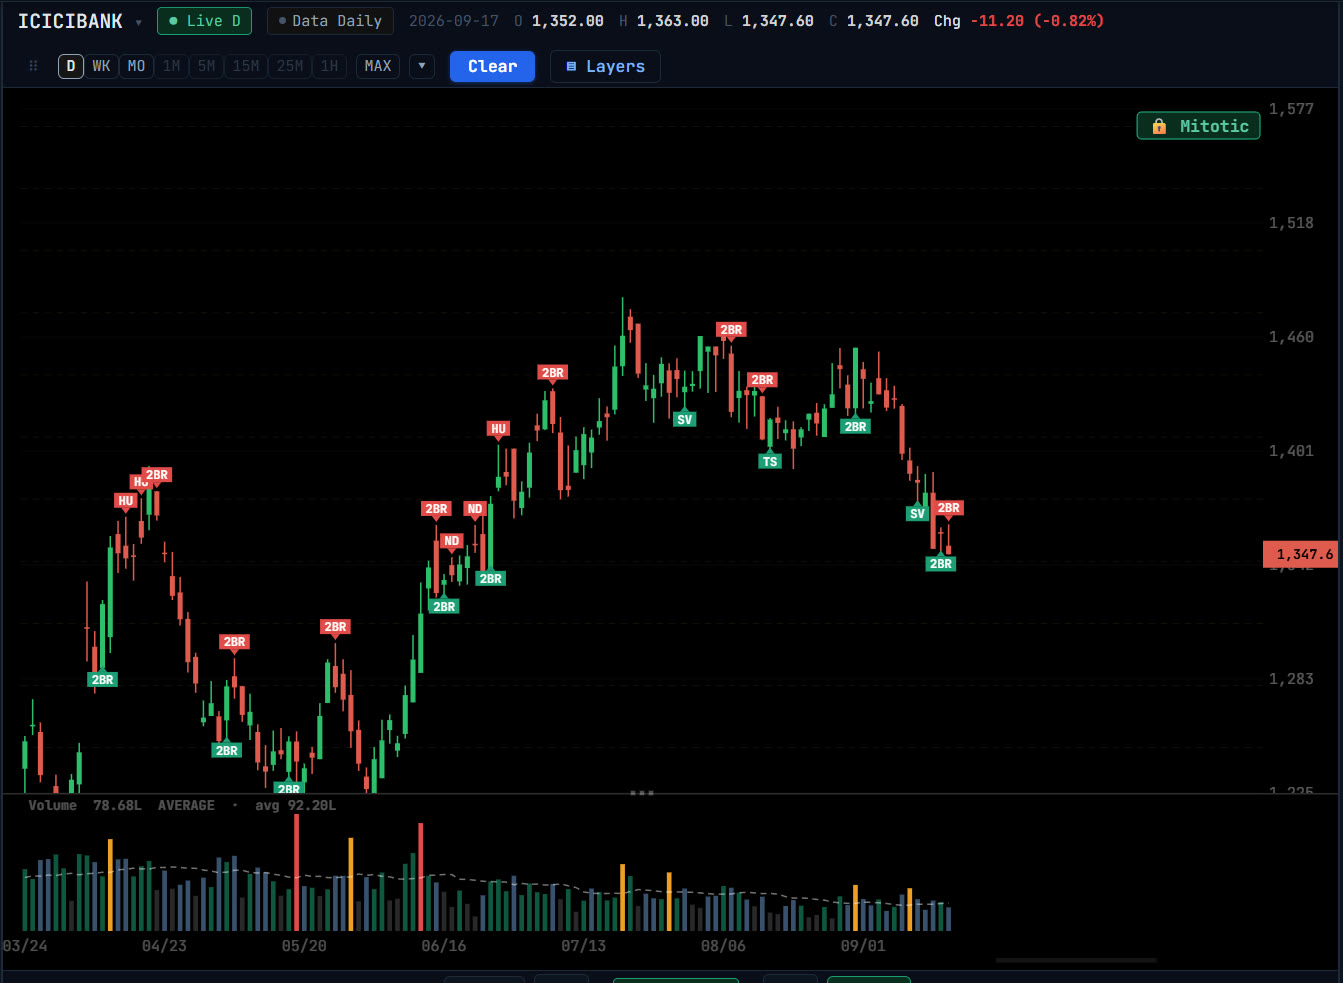
The idea behind VSA
Volume is the effort, and the bar’s spread and close are the result. When the two disagree, something is going on underneath: heavy volume that fails to push price further means someone large is absorbing it, and a move on very little volume has no one behind it.
VSA is a published method, so Geometriya runs it on the daily candles of any chart, on every exchange, including charts imported from CSV.
Signs of strength
- Selling Climax
- A wide down bar on ultra-high volume into new low ground, closing well off its low. Panic selling is being absorbed.
- Stopping Volume
- A down bar on high volume closing in the upper half of its range. Buying is stopping the fall.
- Shakeout
- Price drops below recent lows on a wide spread, then closes back near the high. The breakdown was not real.
- Test
- A dip into old supply on low volume, closing near the high. Almost nobody still wanted to sell.
- No Supply
- A narrow down bar on volume lower than the two bars before it. Sellers have lost interest.
- Bag Holding
- Ultra-high volume closing on the high, into new low ground. A large holder is taking everything being sold.
- Two-Bar Reversal (up)
- A down bar closing on its low, reversed at once by an up bar closing on its high.
- Strength Coming In
- A wide up bar on high volume closing near its high, out of a down-move. Demand is now visible.
Signs of weakness
- Upthrust
- A new high made and rejected: a wide bar on high volume closing near its low. Buyers were drawn in and sold into.
- Hidden Upthrust
- The same rejection of a new high without the wide spread, harder to spot for that reason.
- No Demand
- A narrow up bar on volume lower than the two bars before it, in an up-move. Price is rising with no buying behind it.
- Supply Coming In
- An up bar on very high volume closing in the lower part of its range. Selling met the buying and won the bar.
- Others
- End of Rising Market, No Result From Effort, Two-Bar Reversal (down) and Failed Test complete the set.
Using it in Geometriya
- 1Click the volume-bars icon in the toolbar. The volume pane opens and the signals are marked on the price bars: strength below a bar, weakness above it.
- 2Tap any marker to read what that signal is and why it matters.
- 3Open the VSA Scanner from the same button’s menu to list the stocks showing a recent sign of strength or weakness.
Questions
Is VSA the same as Wyckoff?
VSA grew out of Richard Wyckoff’s work on effort and result, and was developed further by Tom Williams. It reads individual bars for the same supply and demand Wyckoff studied in whole ranges.
Does a VSA signal mean buy or sell?
No. A signal describes what volume suggests about that bar. It reads best where another tool already marks a level, such as a demand zone, a Gann arc or a 45° angle.
Which timeframe does it use?
The signals and the scanner run on daily candles.